Skip to content
MathsGenie logo
Open app

Course home

  1. A Level
  2. Biology OCR A
  3. Question bank

Populations and sustainability

EasyMedium
123456789101112131415161718192021
Question 21

A group of students investigated the population growth of a bacterial culture in a flask. They monitored both the total population size and the viable (living) population size over a 60-hour period. The results are shown in the graph below.
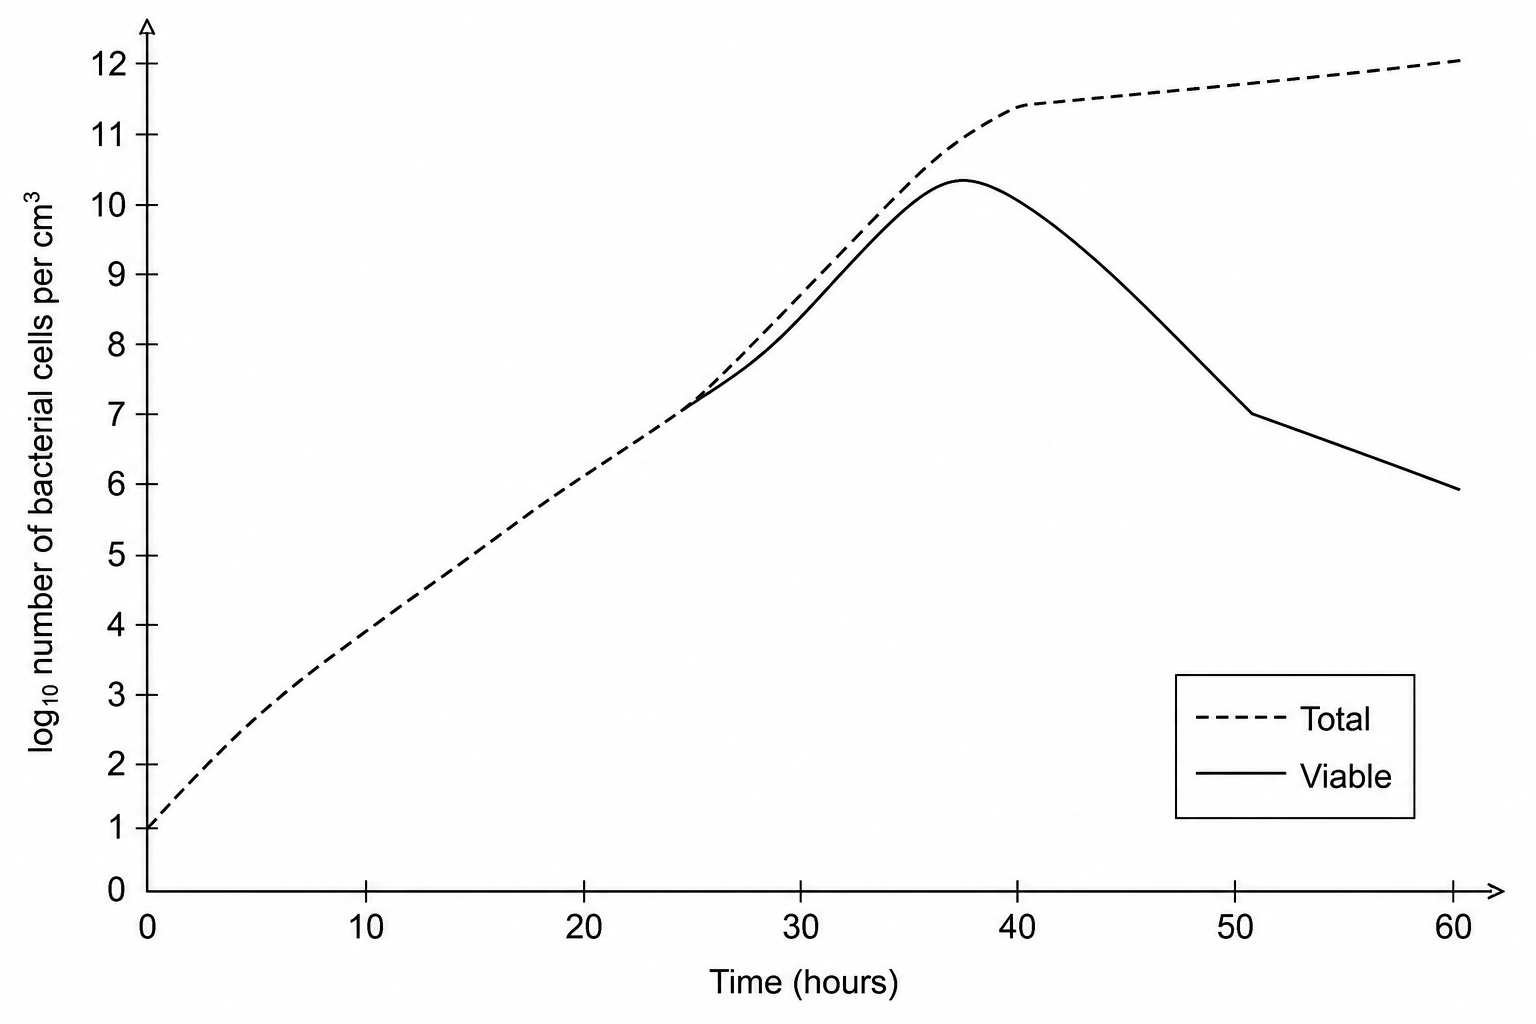
Line graph showing the growth of a bacterial culture over time. The horizontal axis represents Time from 0 to 60 hours, labeled every 10 hours. The vertical axis is labeled log10 number of bacterial cells per cm3 and ranges from 0 to 12. There are two lines on the graph: a dashed line for 'Total' cell count and a solid line for 'Viable' cell count. At 50 hours, the solid line for 'Viable' bacteria is at exactly 7.0 on the vertical scale. At 60 hours, the solid line for 'Viable' bacteria is at exactly 6.0 on the vertical scale. At 0 hours, the log10 number of cells is 1.0, while at 60 hours, the log10 of total cells is 12.0.

a.

Explain, with reference to the data, why the students used a logarithmic scale (log⁡10\log_{10}log10​) on the y-axis.

[2]
b.

Calculate the percentage decrease in the viable population of bacteria between 50 hours and 60 hours. Give your answer to 3 significant figures.


[4]

Populations and sustainability Questions

  1. A Level
  2. /Biology
  3. /Populations and sustainability