A group of researchers investigated the population dynamics of a microalgae culture (Chlorella vulgaris) in a photobioreactor. They monitored both the total cell density and the viable (living) cell density over an 80-hour period. The results are shown in the graph below.
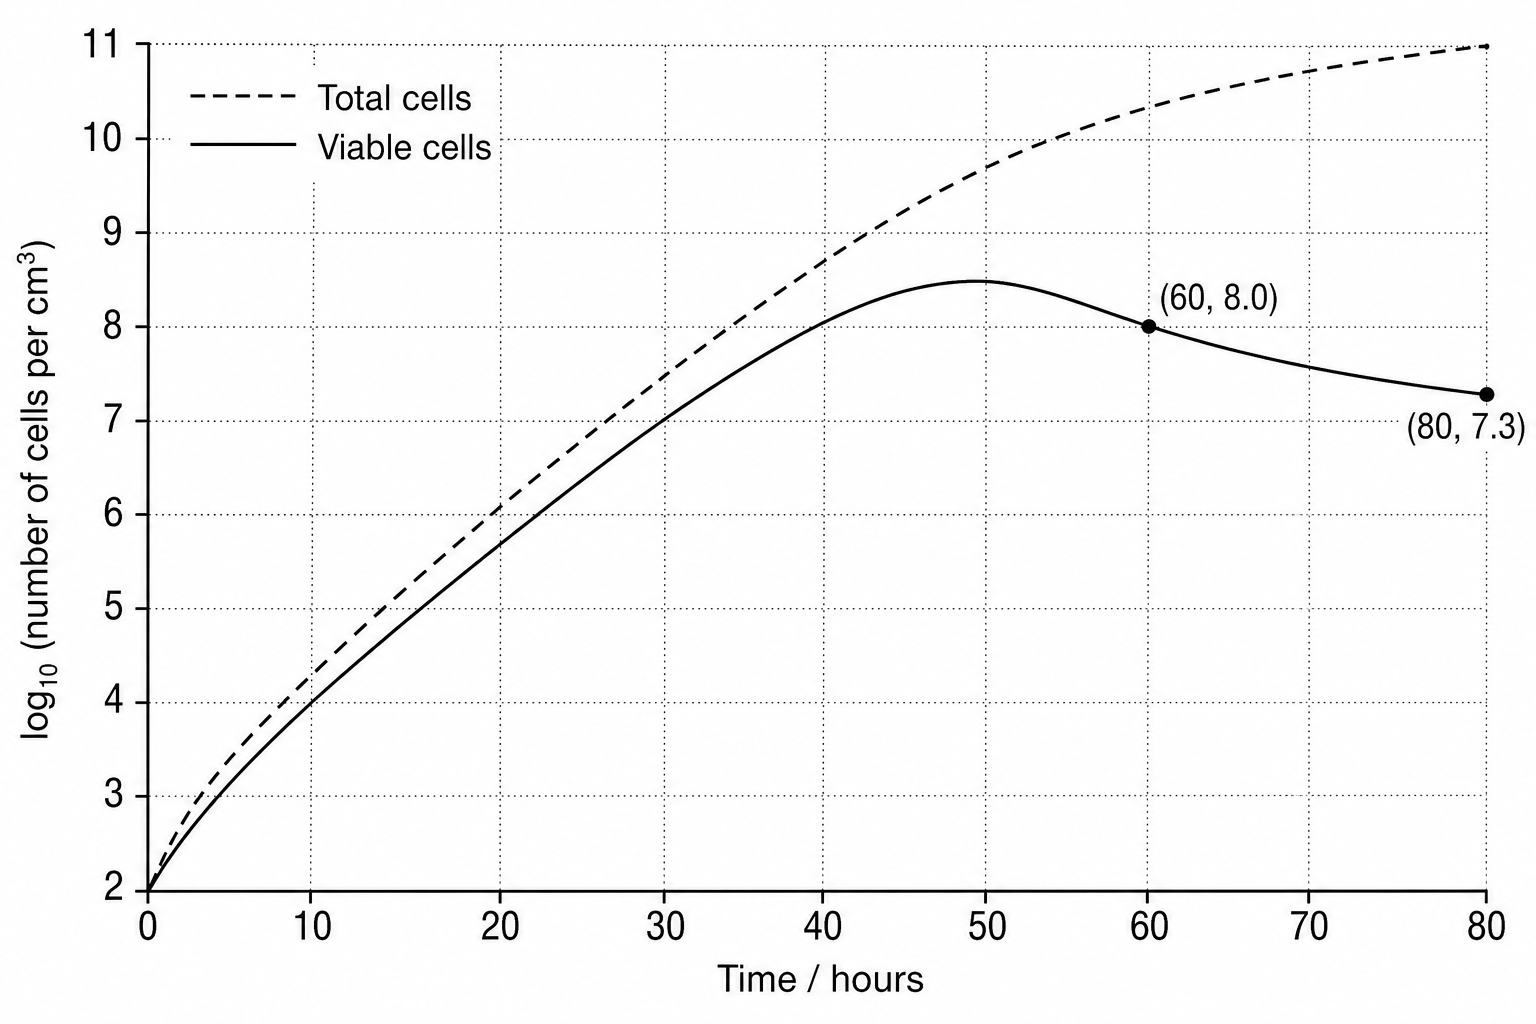
Explain, with reference to the data in the graph, why the researchers used a logarithmic scale (log10\log_{10}log10) on the y-axis.
Calculate the percentage decrease in the viable cell density of the microalgae between 60 hours and 80 hours. Give your answer to 3 significant figures.

