The graph below shows how the birth rate and death rate of a population of small mammals change with population size (NNN) in an isolated grassland ecosystem.
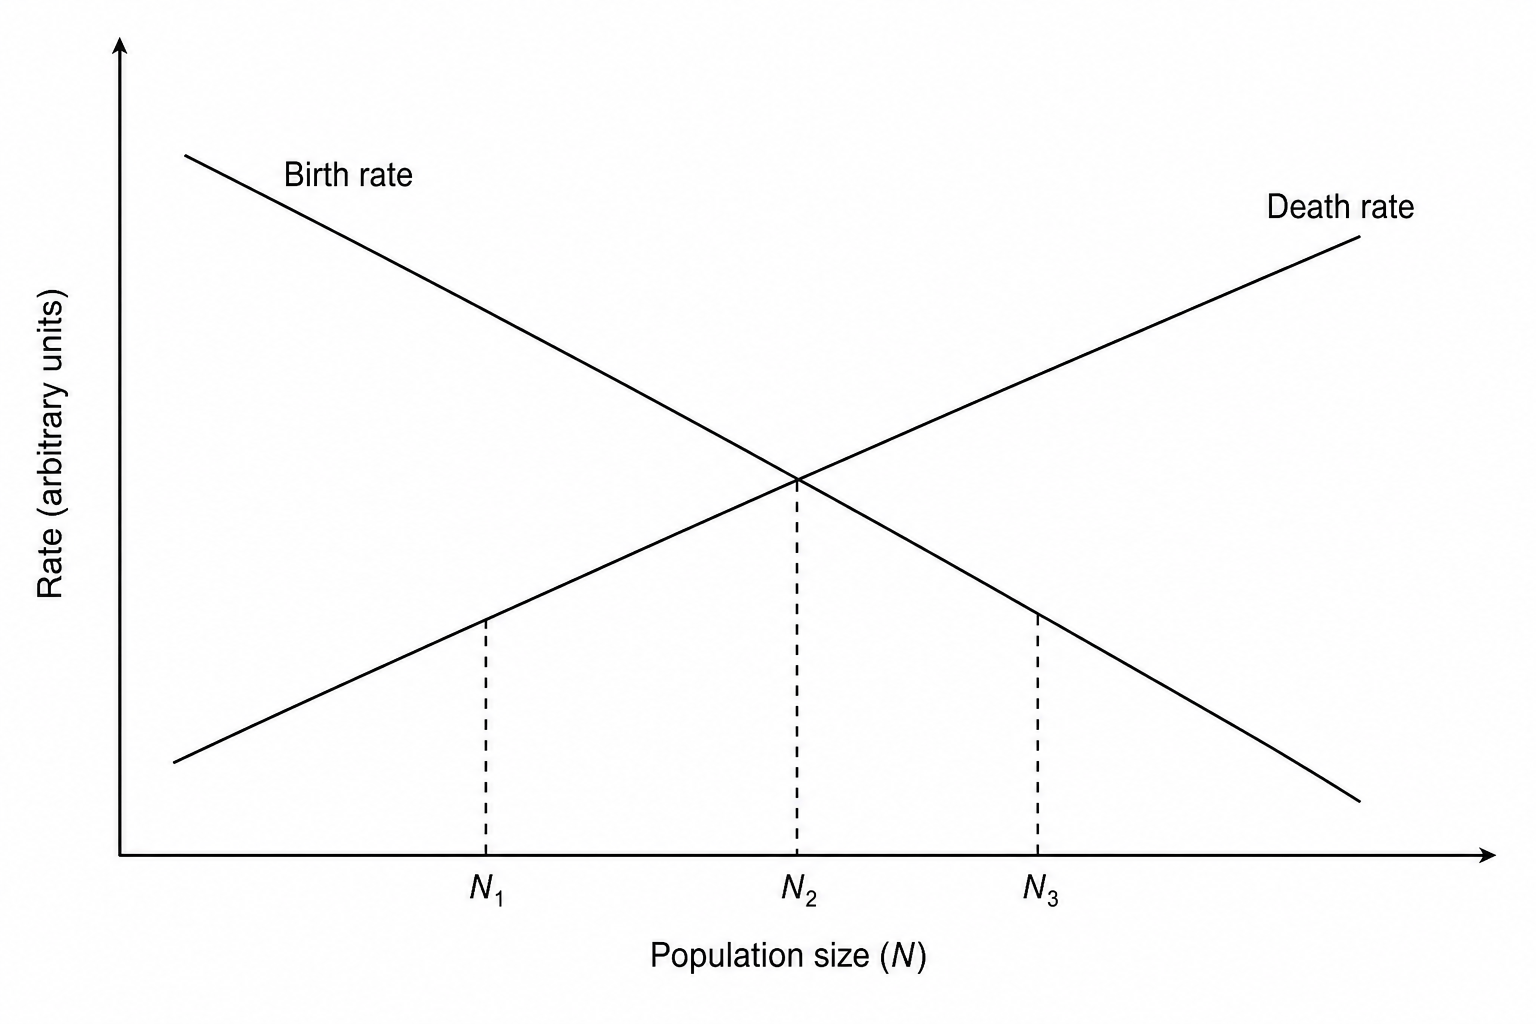
Which of the following correctly describes the dynamics and limiting factors of the population at sizes N1N_1N1, N2N_2N2, and N3N_3N3?
At N1N_1N1, the population is declining because small populations suffer from low genetic diversity; at N2N_2N2, the population is growing exponentially because birth rate and death rate are balanced; at N3N_3N3, the population is stable because density-independent factors regulate growth.
At N1N_1N1, the population is growing rapidly because birth rate is at its minimum value; at N2N_2N2, the population is declining because carrying capacity has been exceeded; at N3N_3N3, the population size is stable because reproduction has ceased due to intense competition.
At N1N_1N1, the population is increasing because birth rate exceeds death rate, and density-dependent limiting factors are weak; at N2N_2N2, the population size is stable because birth rate equals death rate, representing carrying capacity (KKK); at N3N_3N3, the population is decreasing because death rate exceeds birth rate due to intense intraspecific competition.
At N1N_1N1, the population size is stable because intraspecific competition is absent; at N2N_2N2, the population is undergoing a sudden crash because death rate is at its maximum; at N3N_3N3, the population is increasing because high population size stimulates carrying capacity.

