The graph below shows the standard population growth curve of a single-species culture of the bacterium Lactobacillus acidophilus inside a closed batch bioreactor.
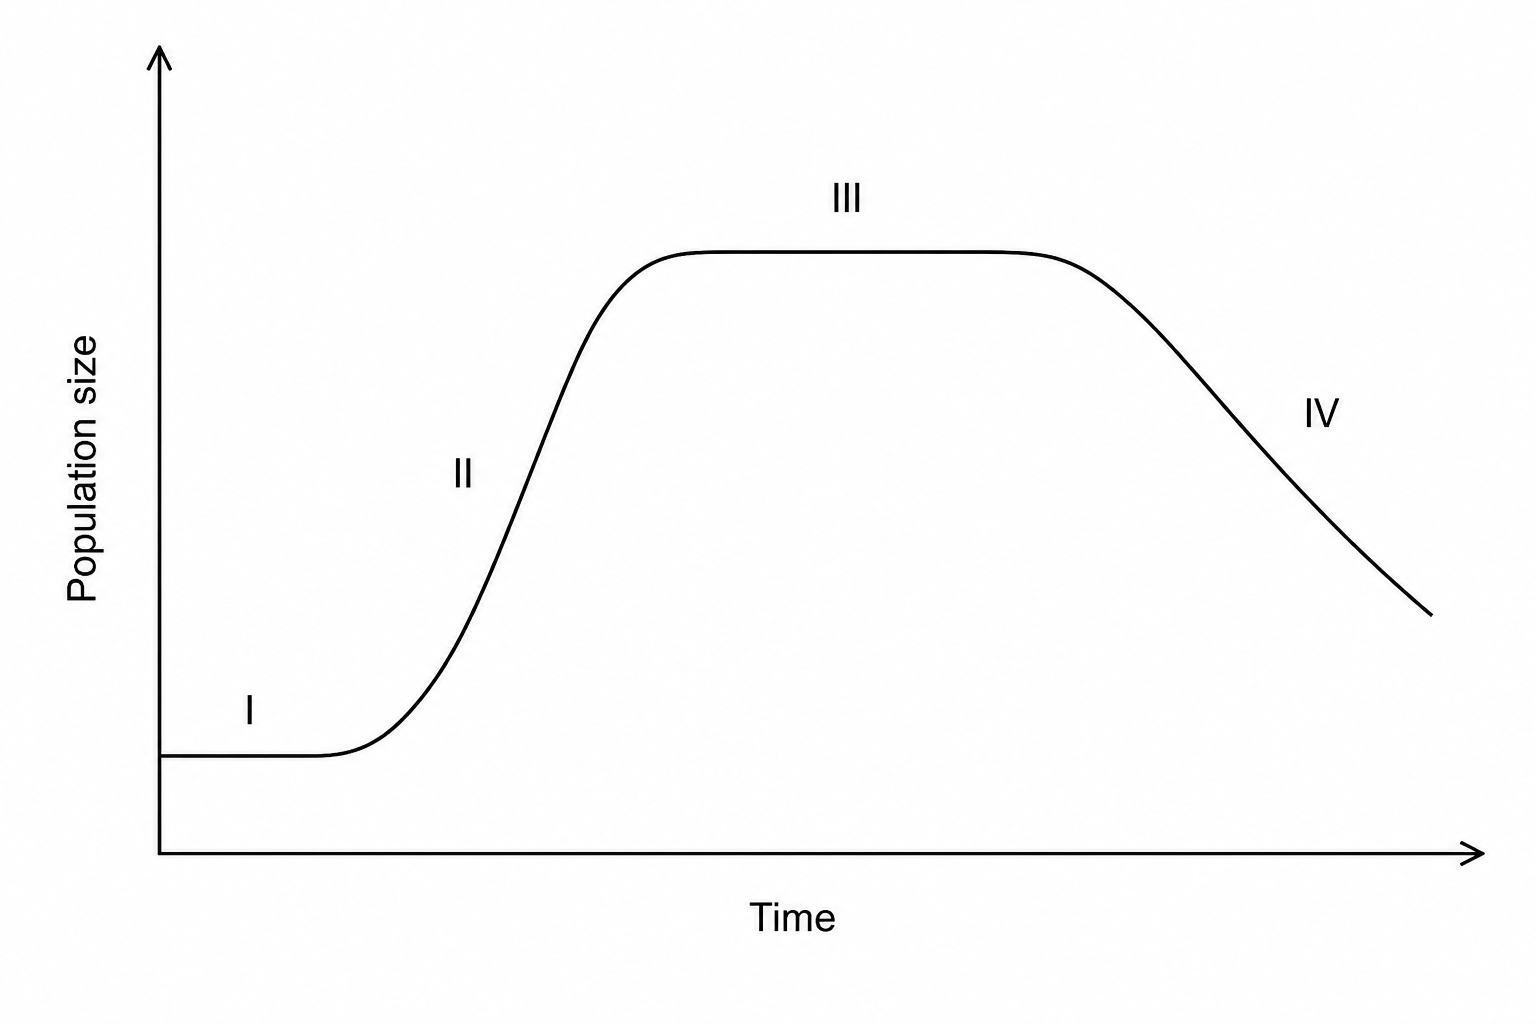
Which option correctly describes the population dynamics and ecological factors operating during phase III?
Interspecific competition for lactose reaches its peak, leading to a stabilization where the rate of binary fission equals the rate of cell death.
The accumulation of lactic acid decreases the pH to a toxic level, causing the rate of cell death to significantly exceed the rate of binary fission.
Intraspecific competition for nutrients increases and lactic acid accumulates, resulting in a rate of binary fission that is equal to the rate of cell death.
Logarithmic division occurs at its maximum rate because metabolic wastes have not yet started to accumulate and space is unlimited.

