A student, Zachary, conducts an experiment to investigate how the concentration of salt (sodium chloride) in a water solution affects the rate at which its temperature decreases when placed in a freezer.
Zachary starts the experiment with a beaker, a bag of sodium chloride, a stirring rod, a kettle of hot water, and a freezer.
Describe how Zachary conducts this experiment.
You should write about:
- the extra equipment Zachary needs and what this equipment measures
- Zachary's method
- a variable that needs to be controlled.
Yara does the same experiment using the exact same method as Zachary.
The table below shows the students' results when there is no salt in the water (0% concentration):
| Time (min) | Temperature of Zachary (∘C^\circ\text{C}∘C) | Temperature of Yara (∘C^\circ\text{C}∘C) |
|---|---|---|
| 0 | 60 | 60 |
| 2 | 48 | 49 |
| 4 | 38 | 37 |
| 6 | 30 | 31 |
| 8 | 24 | 23 |
| 10 | 19 | 19 |
Describe the trend shown by the students' results.
Describe how the table shows that the students' results are reproducible.
The students plot a graph of temperature against time, shown below:
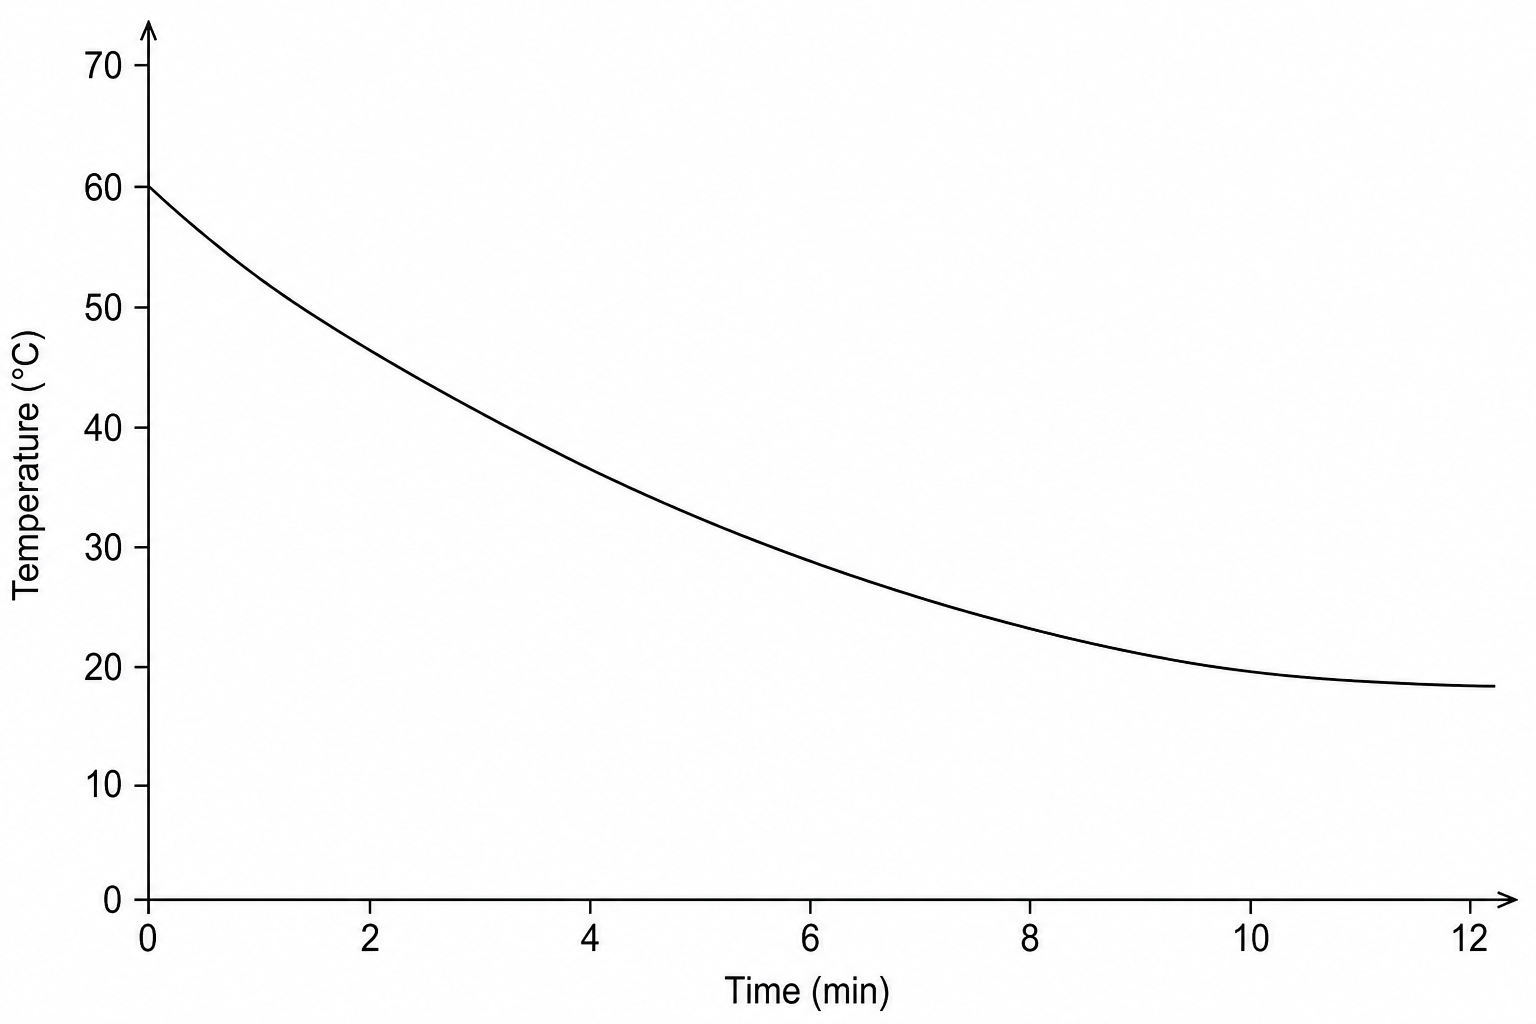
State two reasons why the graph does not show that the temperature of the solution is directly proportional to time.