A solid sample of a pure substance of mass 0.25 kg is heated at a constant rate of 120 W. The graph below shows the variation of the temperature of the sample with time as it changes from a solid to a gas.
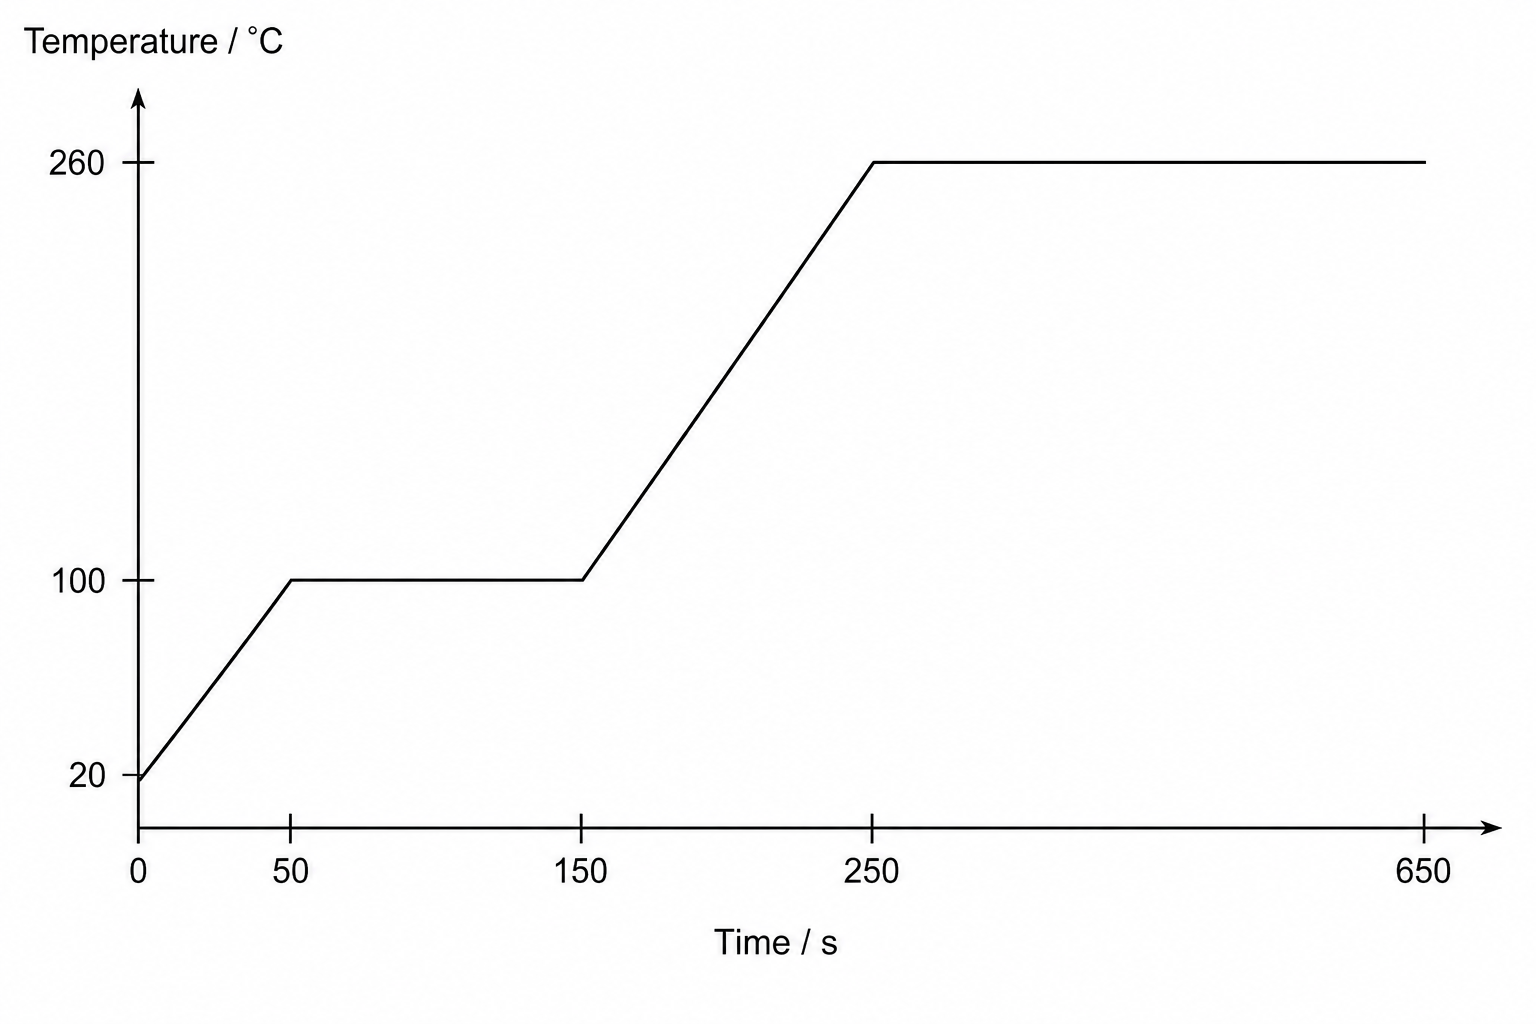
Which row in the table gives the correct values for the specific latent heat of fusion Lf L_f\,Lf and the specific latent heat of vaporisation Lv L_v\,Lv of this substance?
Lf/kJ kg−1Lv/kJ kg−1A48192B72312C19248D2448 \begin{array}{|c|c|c|} \hline & L_f / \text{kJ kg}^{-1} & L_v / \text{kJ kg}^{-1} \\ \hline \textbf{A} & 48 & 192 \\ \hline \textbf{B} & 72 & 312 \\ \hline \textbf{C} & 192 & 48 \\ \hline \textbf{D} & 24 & 48 \\ \hline \end{array} ABCDLf/kJ kg−1487219224Lv/kJ kg−11923124848Row A\textbf{A}A
Row B\textbf{B}B
Row C\textbf{C}C
Row D\textbf{D}D