Question 5
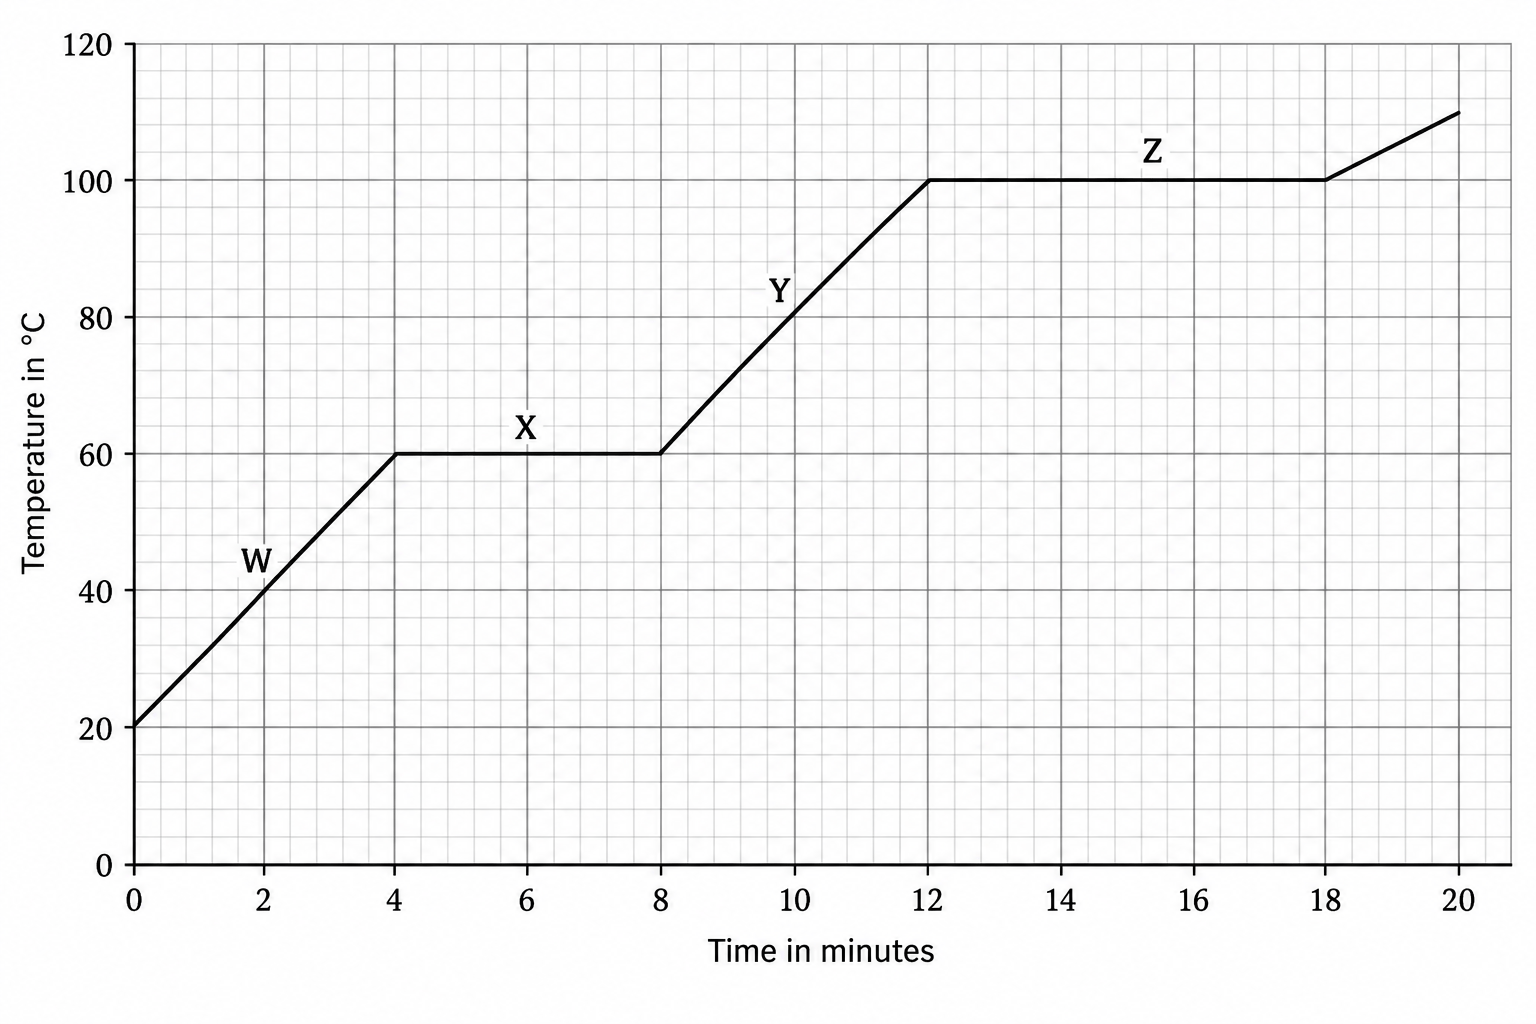
FA pure substance is heated at a constant rate from solid to gas. The figure shows how the temperature of the substance changes with time.
Figure: A graph of temperature against time for a pure substance heated at a constant rate
a.[1]
Use the graph to determine the melting point of the substance.
b.[1]
Give the section of the graph during which the substance is boiling.
c.[2]
Explain why the temperature of the substance does not change during section X.
d.[1]
The substance is heated at the same constant rate throughout.
Suggest why section Z lasts longer than section X.
3.2 Internal energy and energy transfers Questions
40 exam-style questions on AQA GCSE Physics 3.2 Internal energy and energy transfers, covering 3.2.1 Internal energy, 3.2.2 Temperature changes in a system and specific heat capacity, and 3.2.3 Changes of state and specific latent heat. Each one has a worked solution and a mark scheme showing where the marks go.