Wayne has data about the number of goals 10 football players had scored and the number of games they had played. He was asked to display the data on a scatter graph. Here is his answer.
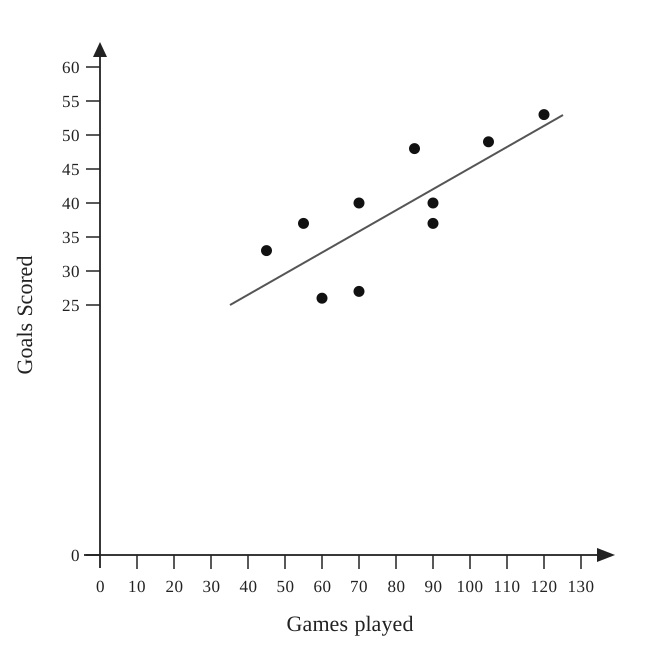
| Games played | Goals Scored |
|---|---|
| 45 | 33 |
| 55 | 37 |
| 60 | 26 |
| 70 | 40 |
| 70 | 27 |
| 85 | 48 |
| 90 | 40 |
| 90 | 37 |
| 105 | 49 |
| 120 | 53 |
Wayne has plotted the points accurately.
Write down one thing that is wrong with his answer.
54 exam-style questions on AQA GCSE Maths Scatter Graphs. Each one has a worked solution and a mark scheme showing where the marks go.

