Question 4
Hannah has data about the age of 10 cars and their current market value. She displayed this on a scatter graph.
On the y-axis (Value), the scale labels are 0,2000,4000,6000,10000,120000, 2000, 4000, 6000, 10000, 120000,2000,4000,6000,10000,12000. Her line of best fit starts at the bottom left of the graph and goes up to the top right.
| Age of Car (Years) | Value (£) |
|---|---|
| 1 | 11500 |
| 2 | 10200 |
| 3 | 9000 |
| 4 | 7800 |
| 5 | 6500 |
| 6 | 5200 |
| 7 | 4100 |
| 8 | 3000 |
| 9 | 1800 |
| 10 | 950 |
Hannah has plotted the points accurately.
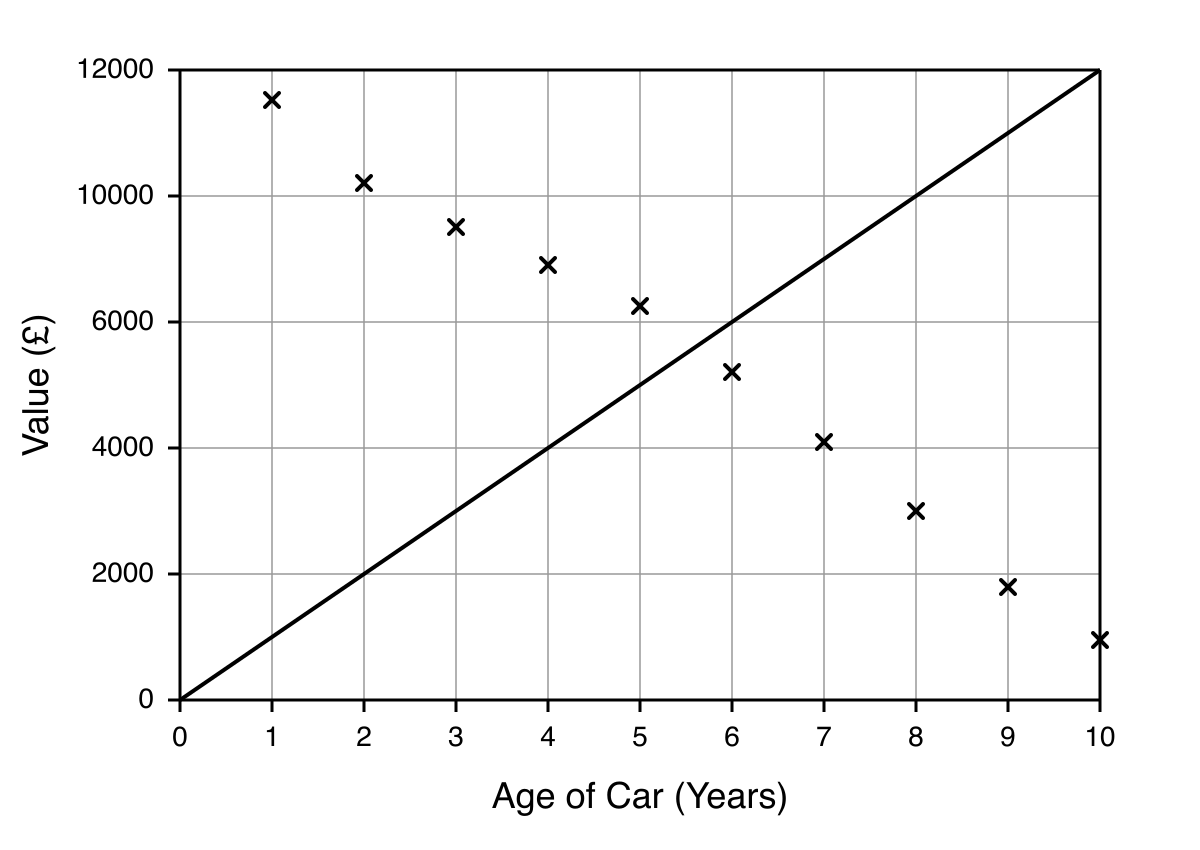
Write down two things that are wrong with her answer.
Scatter Graphs Questions
55 exam-style questions on AQA GCSE Maths Scatter Graphs. Each one has a worked solution and a mark scheme showing where the marks go.