Question 3
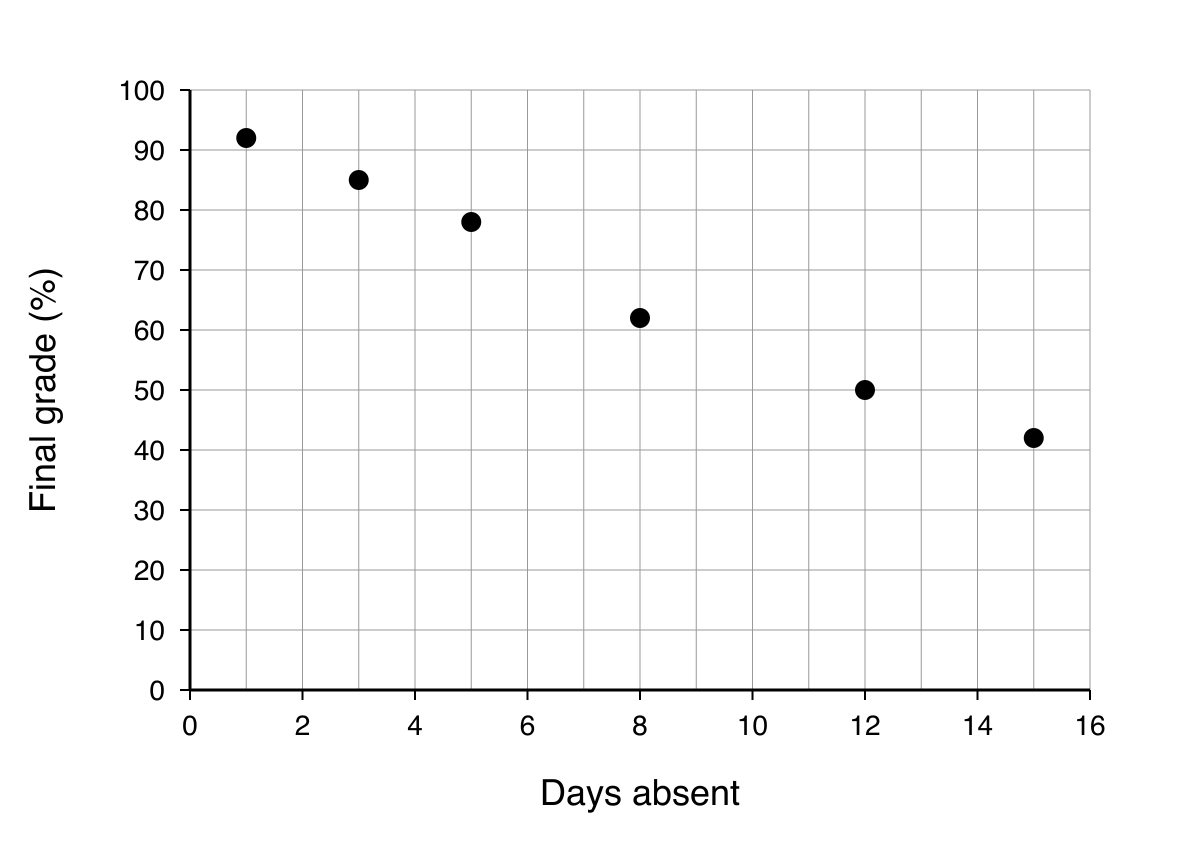
The scatter graph shows information about the number of days a student was absent from school and their final grade in a science exam.
| Days Absent | Final Grade (%) |
|---|---|
| 1 | 92 |
| 3 | 85 |
| 5 | 78 |
| 8 | 62 |
| 12 | 50 |
| 15 | 42 |
a.[1]
What type of correlation does the scatter graph show?
b.[1]
A student says, "If I miss one fewer day of school next term, my science grade will definitely improve." Comment on what the student says.
Scatter Graphs Questions
55 exam-style questions on AQA GCSE Maths Scatter Graphs. Each one has a worked solution and a mark scheme showing where the marks go.