Question 10
HFigure: pH change as calcium oxide is added to hydrochloric acid
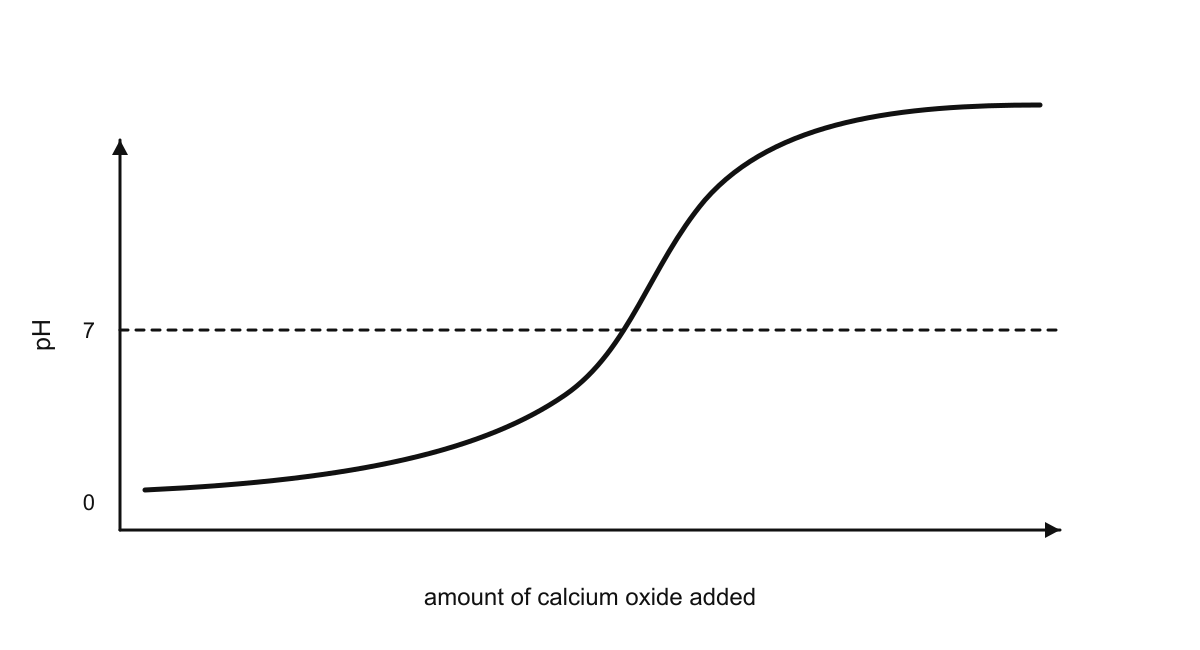
The pH curve shows calcium oxide being added to hydrochloric acid. Which region represents excess calcium oxide?
The high-pH plateau after neutralisation
The low-pH region at the start of the curve
Only the steep rise where the pH passes 7
Every point where the pH is below 7
4.1 Acids Questions
44 exam-style questions on Edexcel GCSE Chemistry 4.1 Acids, covering 4.1.1 Acids, alkalis and the pH scale, 4.1.2 Hydrogen ion concentration and pH, 4.1.3 Dilute and concentrated, weak and strong acids, 4.1.4 Bases, alkalis and the reactions of acids, 4.1.5 Chemical tests for hydrogen and carbon dioxide, 4.1.6 Neutralisation as a reaction of acids with bases, 4.1.7 Preparing soluble salts, and 4.1.8 Solubility rules and preparing insoluble salts. Each one has a worked solution and a mark scheme showing where the marks go.