The graph below shows the results of an oral glucose tolerance test (OGTT) for a healthy individual (Curve P) and an individual with an endocrine disorder (Curve Q).
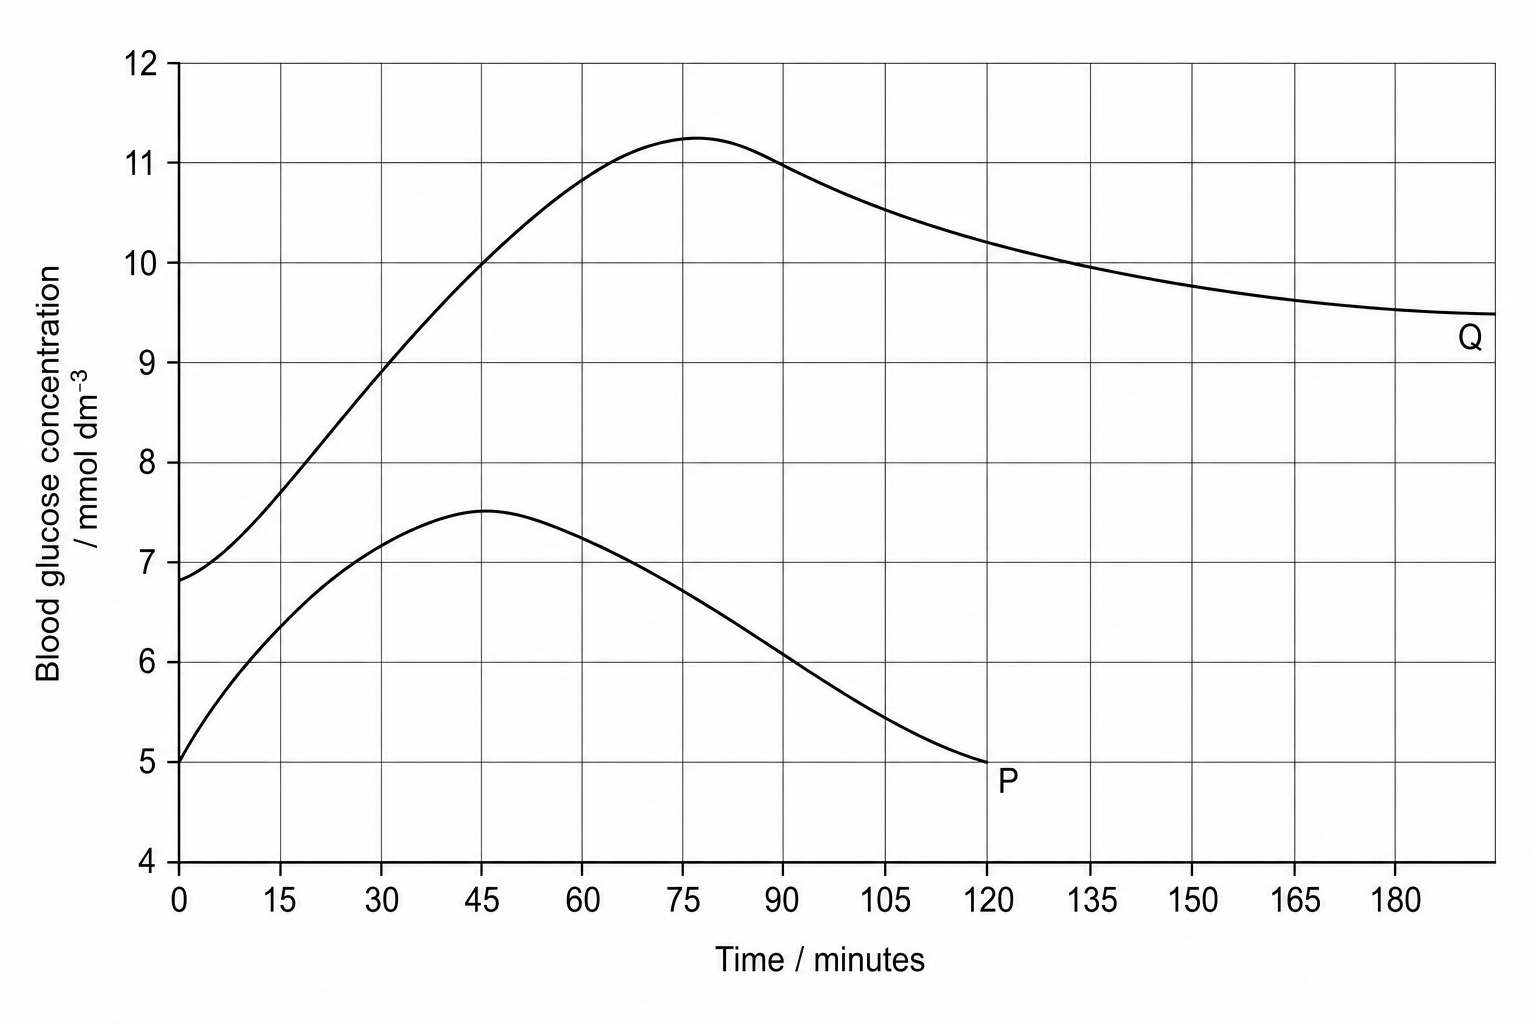
Which of the following options correctly identifies the rate of blood glucose clearance for Curve P between its peak concentration and t=120 minutest = 120\text{ minutes}t=120 minutes, and the most likely molecular cause of the pathology shown in Curve Q?
Rate: 2.0 mmol dm−3 hour−12.0\ \text{mmol}\ \text{dm}^{-3}\ \text{hour}^{-1}2.0 mmol dm−3 hour−1 ; Cause: Autoimmune destruction of pancreatic β\betaβ-cells leading to insufficient insulin secretion.
Rate: 1.25 mmol dm−3 hour−11.25\ \text{mmol}\ \text{dm}^{-3}\ \text{hour}^{-1}1.25 mmol dm−3 hour−1 ; Cause: Autoimmune destruction of pancreatic α\alphaα-cells leading to excess glucagon secretion.
Rate: 2.0 mmol dm−3 hour−12.0\ \text{mmol}\ \text{dm}^{-3}\ \text{hour}^{-1}2.0 mmol dm−3 hour−1 ; Cause: Overexpression of GLUT4 glucose transporter proteins on the sarcolemma of skeletal muscle fibers.
Rate: 3.3 mmol dm−3 hour−13.3\ \text{mmol}\ \text{dm}^{-3}\ \text{hour}^{-1}3.3 mmol dm−3 hour−1 ; Cause: Downregulation or mutation of glycoprotein insulin receptors on the membrane of hepatocytes.