Skip to content
MathsGenie logo
Open app

Course home

  1. GCSE
  2. Biology Edexcel
  3. Question bank

Hormones, the menstrual cycle and reproduction

EasyMediumHard
123456789101112131415161718192021222324252627282930313233343536373839404142434445464748
Question 46

A student studied how the concentration of reproductive hormones changes in women as they get older.

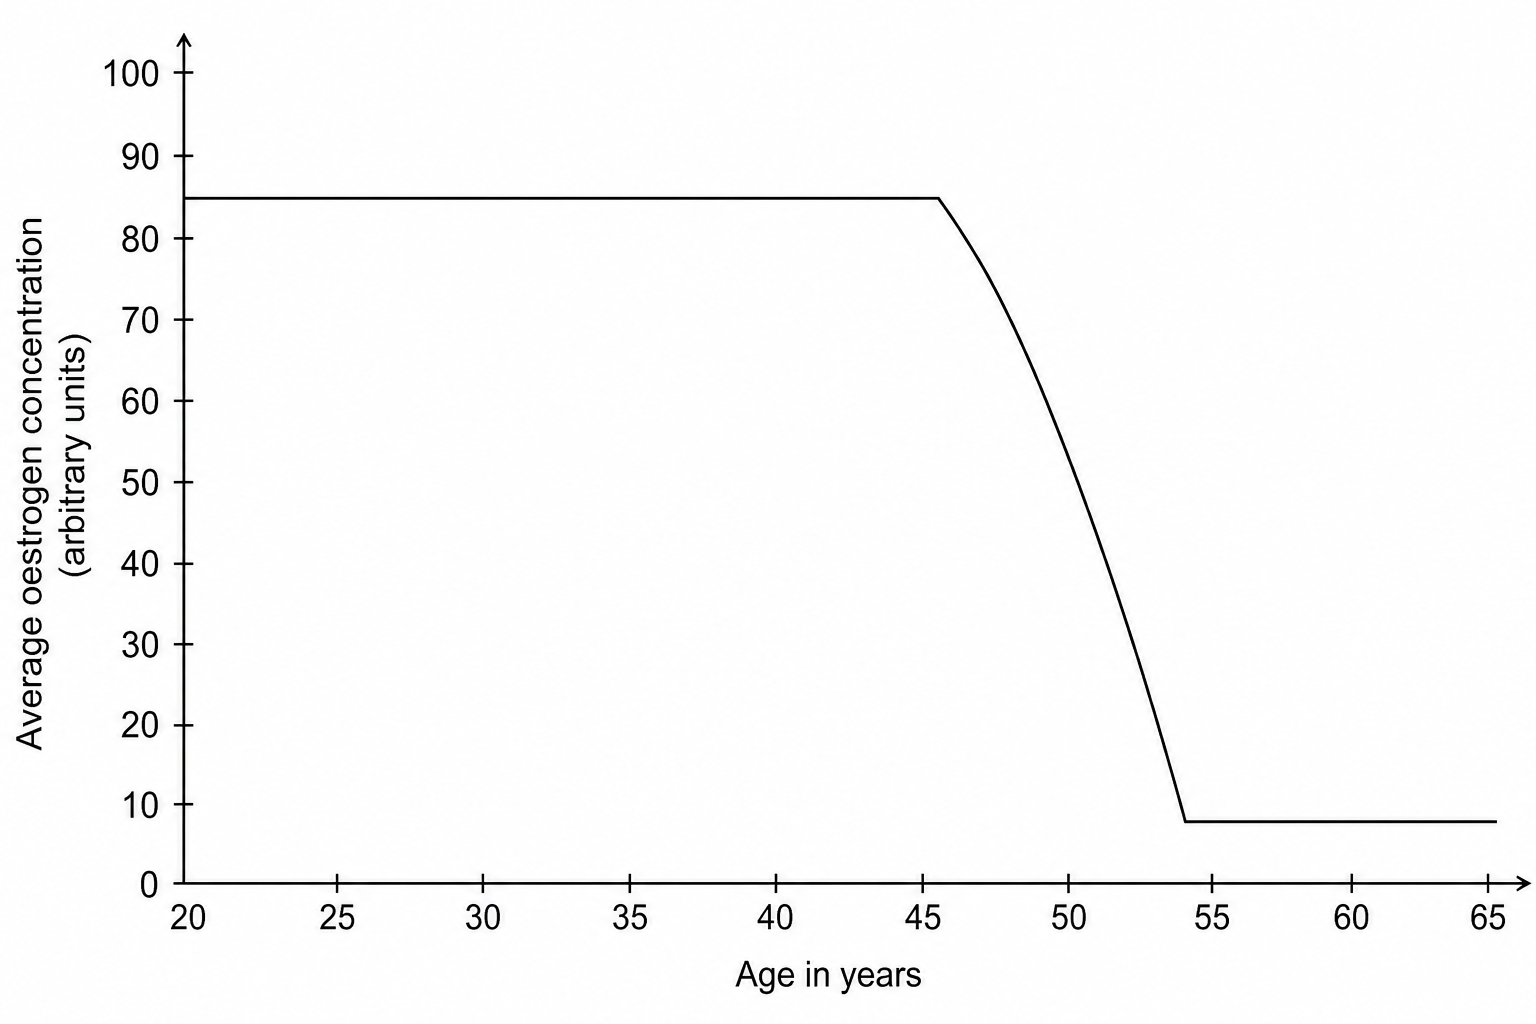
Figure 1 is a line graph showing the average concentration of oestrogen in the blood of women of different ages. The x-axis is labelled 'Age in years' and ranges from 20 to 65. The y-axis is labelled 'Average oestrogen concentration (arbitrary units)' and ranges from 0 to 100. The curve shows a constant high level of around 85 units from age 20 to 45, followed by a steep decrease between the ages of 45 and 52. After age 52, the curve flattens out and remains at a very low level of around 8 units up to age 65.

Use information from Figure 1 to explain why women are much less likely to become pregnant naturally after the age of 50.

[2]

Hormones, the menstrual cycle and reproduction Questions

  1. GCSE
  2. /Biology
  3. /Hormones, the menstrual cycle and reproduction
