Skip to content
MathsGenie logo
Open app

Course home

  1. GCSE
  2. Biology Edexcel
  3. Question bank

Enzymes

EasyMediumHard
123456789101112131415161718192021222324252627282930313233343536373839
Question 36

An experiment was carried out to investigate the effect of temperature on the rate of amylase activity. The results are shown in the table below.
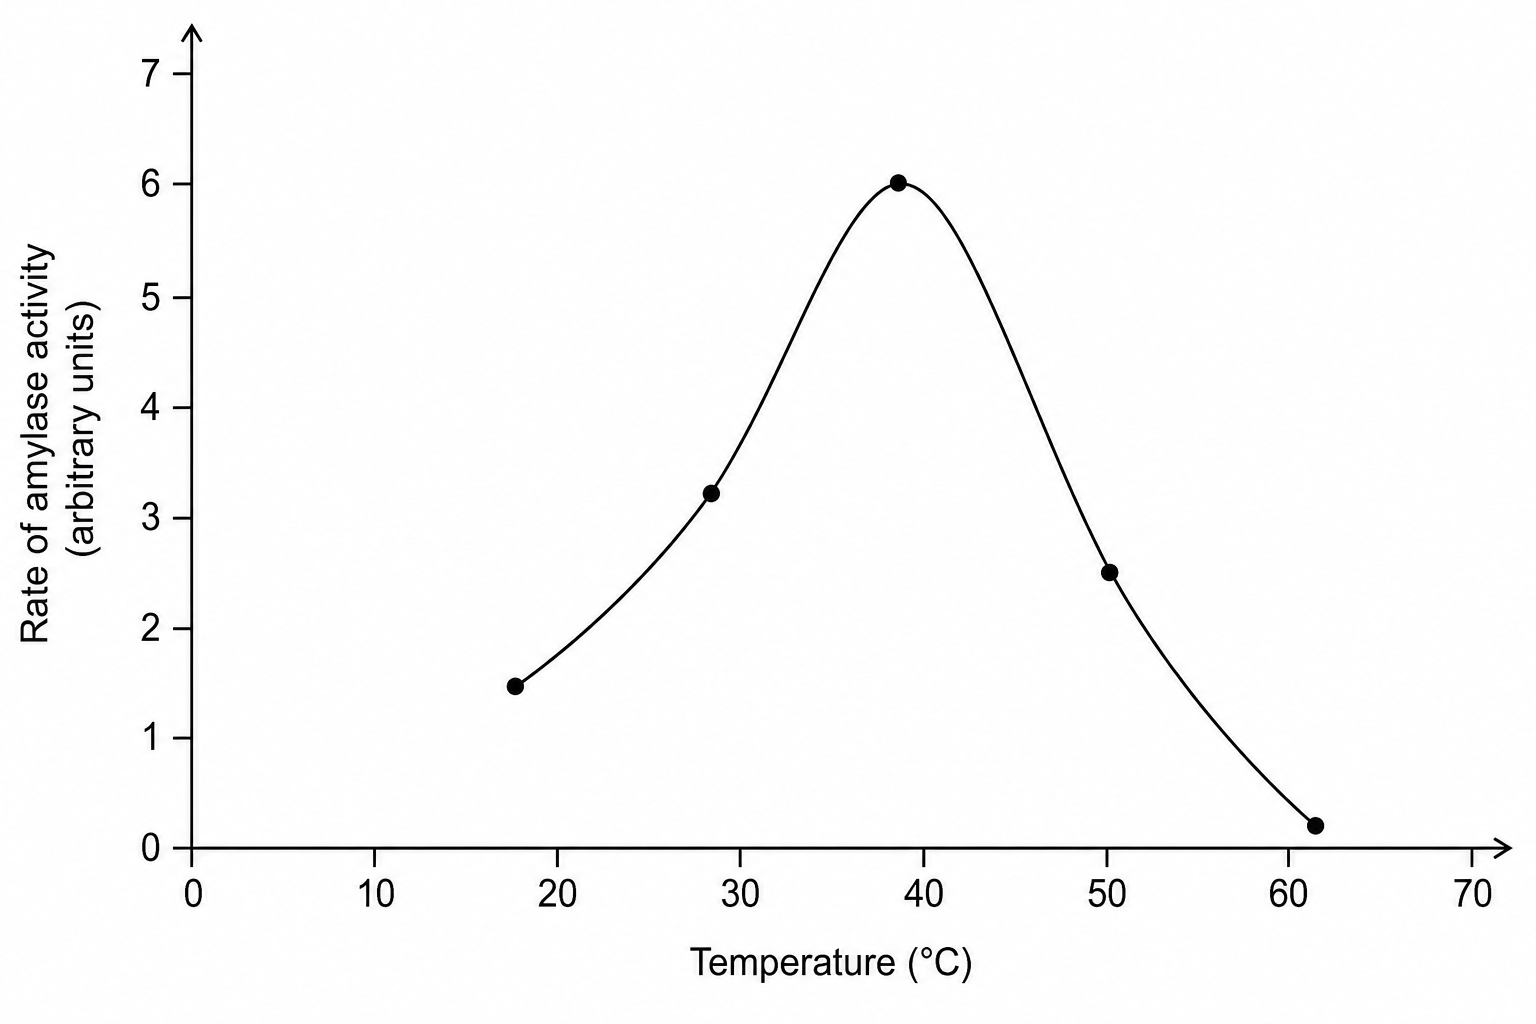
A line graph plotted from the table showing the rate of amylase activity on the y-axis (arbitrary units, from 0 to 7) against temperature on the x-axis (in degrees Celsius, from 0 to 70). The curve rises steadily from 20 °C, peaks at 40 °C, and then drops sharply towards zero by 65 °C.

Temperature (∘C^\circ\text{C}∘C)Rate of amylase activity (arbitrary units)
201.5
303.2
406.0
502.5
600.2

Explain why the activity of amylase decreases at temperatures above 40 ∘C^\circ\text{C}∘C.

[2]

Enzymes Questions

  1. GCSE
  2. /Biology
  3. /Enzymes
