An athlete's physiological response during a graded exercise test on a stationary bicycle was monitored. A researcher investigated how stroke volume (the volume of blood pumped out of the left ventricle of the heart with each beat) changed with work rate (measured in Watts, W).
The results are shown in Figure 1 and the accompanying table.
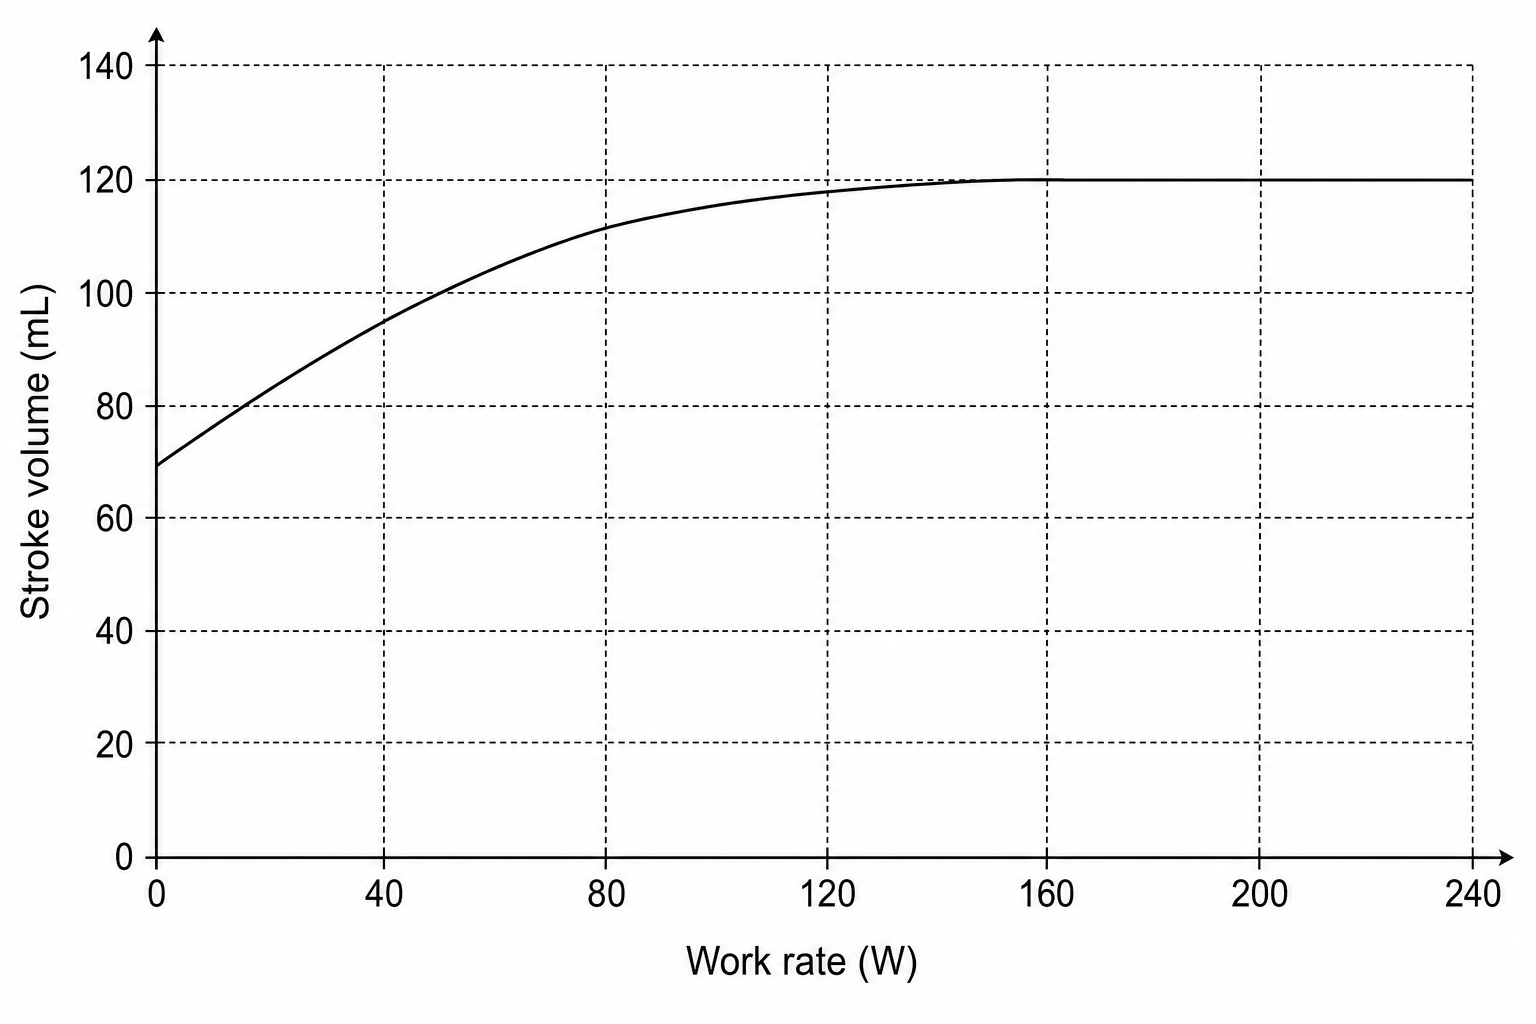
Figure 1
| Work rate (W) | Stroke volume (mL) |
|---|---|
| 0 | 70 |
| 40 | 95 |
| 80 | 112 |
| 120 | 118 |
| 160 | 120 |
| 200 | 120 |
| 240 | 120 |
Describe the trend shown in Figure 1.