Question 31
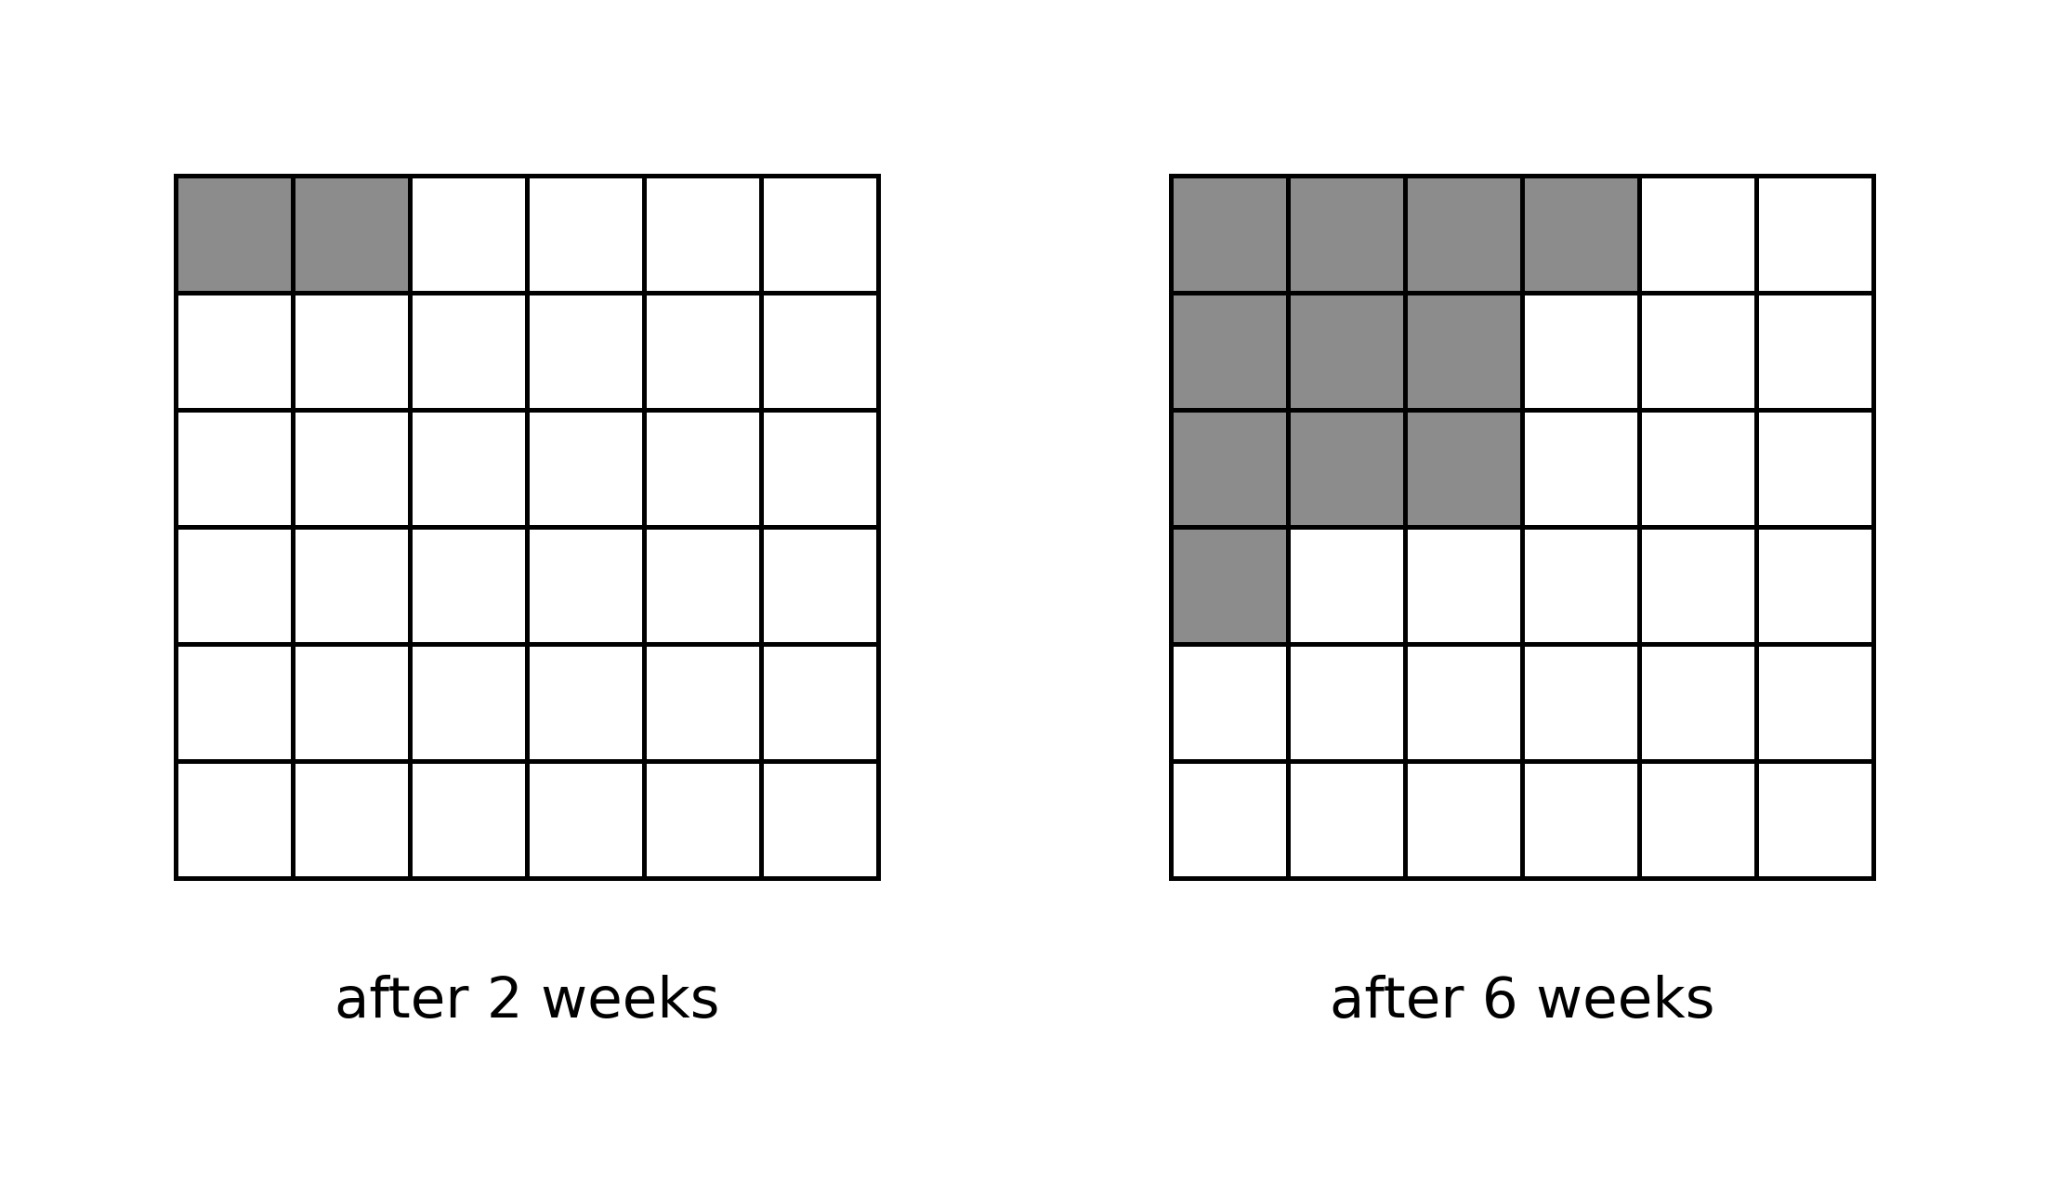
HThe figure shows the same orchard 2 weeks and 6 weeks after a disease was first found in it. Each square represents one tree. Shaded squares are trees showing signs of the disease.
Figure: The positions of the trees showing signs of disease in one orchard, after 2 weeks and after 6 weeks
a.[2]
Calculate the mean number of trees per week that began to show signs of the disease between week 2 and week 6.
b.[2]
Describe the pattern of the spread of the disease shown in the figure.
c.[2]
Explain how this pattern supports the conclusion that the cause is a pathogen and not a shortage of an ion in the soil.
3.3 Plant disease Questions
57 exam-style questions on AQA GCSE Biology 3.3 Plant disease, covering 3.3.1 Detection and identification of plant diseases and 3.3.2 Plant defence responses. Each one has a worked solution and a mark scheme showing where the marks go.