GCSE Latin Grade 9 Rate: How Many Achieve It?
GCSE Latin grade 9 rate explained using 2025 results, recent yearly trends and comparisons with maths, English, history, French and all GCSEs.
The number on a results sheet can feel personal. Yet the statistics behind it belong to a much larger story: who took the subject, which exam board they used and how that year's papers performed.
The latest gcse latin grade 9 rate is roughly 35%35\%35%. Across the main OCR and Eduqas qualifications in summer 2025, approximately 2,9002,9002,900 of the 8,4038,4038,403 Latin candidates achieved grade 9. That is close to 111 in every 333 entries; far higher than the rate across GCSE subjects generally and the rate for GCSE maths.
That does not mean Latin is easy. It means its cohort is small, distinctive and not directly comparable with the hundreds of thousands of students taking compulsory subjects. For maths students, this is a useful lesson in statistics: a percentage tells you what happened, but the population tells you what that percentage means.
The GCSE Latin grade 9 rate at a glance
Here is the short version based on the latest published summer results statistics from OCR, Eduqas, JCQ and Ofqual:
- Around 34.6%34.6\%34.6% of GCSE Latin entries received grade 9 in 2025.
- This represents approximately 2,9002,9002,900 candidates from 8,4038,4038,403 entries across OCR and Eduqas.
- OCR reported a grade 9 rate of 37.5%37.5\%37.5% for its main Latin specification.
- Eduqas reported a final grade 9 rate of 30.5%30.5\%30.5%.
- The combined Latin rate has remained around one-third in each of the last three summer series.
- Across all GCSE subjects in England, only about 5%5\%5% of entries achieved grade 9 in 2025.
- GCSE maths had a grade 9 rate of roughly 3.2%3.2\%3.2% across all ages in England.
These figures describe entries rather than unique students. In most subject-level discussion, one entry corresponds to one candidate taking that qualification, but official statistics are normally presented as examination results or entries.
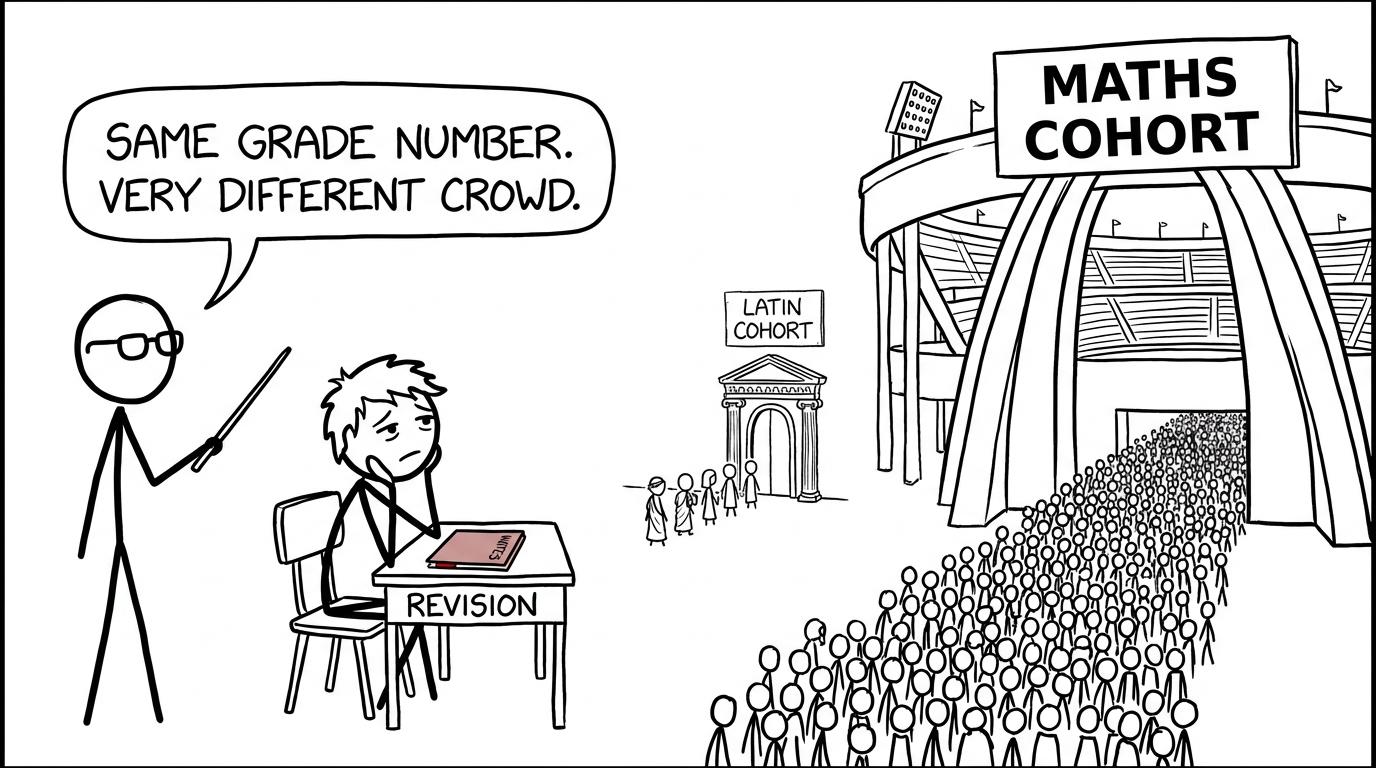 A Latin cohort enters a Roman arch while the maths cohort enters a stadium
How many students achieved grade 9 in 2025?
OCR and Eduqas are the principal exam boards offering reformed GCSE Latin qualifications graded from 9 to 1. Their 2025 results provide the clearest answer.
| Exam board | Latin entries | Grade 9 rate | Approximate grade 9 entries |
|---|---|---|---|
| OCR | 4,9454,9454,945 | 37.5%37.5\%37.5% | 1,8551,8551,855 |
| Eduqas | 3,4583,4583,458 | 30.5%30.5\%30.5% | About 1,0551,0551,055 |
| Combined | 8,4038,4038,403 | About 34.6%34.6\%34.6% | About 2,9102,9102,910 |
OCR publishes the actual cumulative candidate count at grade 9, so its figure of 1,8551,8551,855 is exact within the provisional June statistics. Eduqas publishes the final percentage to one decimal place, meaning its candidate total must be treated as an approximation when reconstructed from the published rate.
The most responsible summary is therefore: about 2,9002,9002,900 students achieved grade 9 in GCSE Latin in 2025.
The combined percentage is calculated from the candidate totals rather than by simply averaging the two board percentages. This matters because the boards have different cohort sizes. In statistical language, the result is a weighted rate.
How has the Latin grade 9 rate changed each year?
One year's result can be affected by paper difficulty, cohort performance and the process used to maintain grading standards. A short trend is more informative.
| Summer series | OCR grade 9 rate | Eduqas grade 9 rate | Estimated combined rate |
|---|---|---|---|
| 2023 | 40.36%40.36\%40.36% | 26.2%26.2\%26.2% | About 35.5%35.5\%35.5% |
| 2024 | 37.86%37.86\%37.86% | 27.5%27.5\%27.5% | About 33.9%33.9\%33.9% |
| 2025 | 37.5%37.5\%37.5% | 30.5%30.5\%30.5% | About 34.6%34.6\%34.6% |
The broad picture is stability, not a dramatic rise or fall. The combined proportion has stayed between approximately 34%34\%34% and 36%36\%36% over these three years.
There has been more movement within individual boards. OCR's rate has eased from just over 40%40\%40% in 2023 to 37.5%37.5\%37.5% in 2025, while the Eduqas rate has risen from 26.2%26.2\%26.2% to 30.5%30.5\%30.5%. Those changes should not be interpreted as proof that one specification became easier or harder. Different students take each board, and grade boundaries are set for a particular examination series.
This is the same reason a maths student should not compare raw grade boundaries from different boards without checking the total marks, tier and paper structure. If you want revision matched to your own specification, begin with the GCSE maths revision hub and select your exam board rather than relying on somebody else's score.
How Latin compares with other GCSEs
Latin's top-grade rate is unusually high. The following rounded comparisons use 2025 results for England and are intended to show scale rather than suggest that the subjects are equally selective.
| GCSE subject or group | Approximate grade 9 rate in 2025 |
|---|---|
| Latin, OCR and Eduqas combined | 34.6%34.6\%34.6% |
| French | 8.7%8.7\%8.7% |
| History | About 5.0%5.0\%5.0% |
| All GCSE subjects | About 5.0%5.0\%5.0% |
| Mathematics | About 3.2%3.2\%3.2% |
| English language | About 2%2\%2% |
On the surface, a Latin entry was therefore much more likely to receive grade 9 than a maths entry. But this is a comparison between different populations.
GCSE maths is effectively universal for the main age cohort and had more than 831,000831,000831,000 results issued in England in summer 2025. Latin had only 8,4038,4038,403 entries across the two main boards represented above. Latin is also offered by a more limited range of schools, and the students entered are self-selecting or selected through their school's curriculum arrangements.
None of that diminishes the achievement. Translation accuracy, vocabulary, grammar and literary analysis require substantial knowledge. It simply explains why the percentage should not be read as a universal probability that any randomly chosen student would earn grade 9.
A high rate can coexist with a demanding examination when the candidates entering it are a small and academically prepared group. The denominator is doing quiet but important work.
What the comparison means for GCSE maths students
If your real concern is whether a maths grade 9 is possible, Latin's result rate cannot answer that question. Your own paper evidence can.
Maths has foundation and higher tiers. Grade 9 is available only on higher tier, while the national maths rate includes a much broader population taking both tiers. Students also follow different boards, including Edexcel, AQA, OCR and Eduqas, with different total marks and grade boundaries.
This makes personal diagnostic evidence more useful than a national percentage. Use GCSE past papers organised by exam board, sit the correct tier under timed conditions and mark the paper honestly. The purpose is not to predict a grade from one attempt. It is to identify where marks are repeatedly escaping.
A reliable revision cycle is:
- choose one weak topic identified from a paper;
- use a revision lesson to rebuild the method;
- complete focused practice questions;
- check the mark scheme or video solution;
- record the exact reason for each lost mark;
- retest the topic after a short gap.
The guide to finding your weakest GCSE topics explains how to turn paper performance into a manageable priority list. If time is limited, the 20-minute maths revision routine provides a smaller version of the same process.
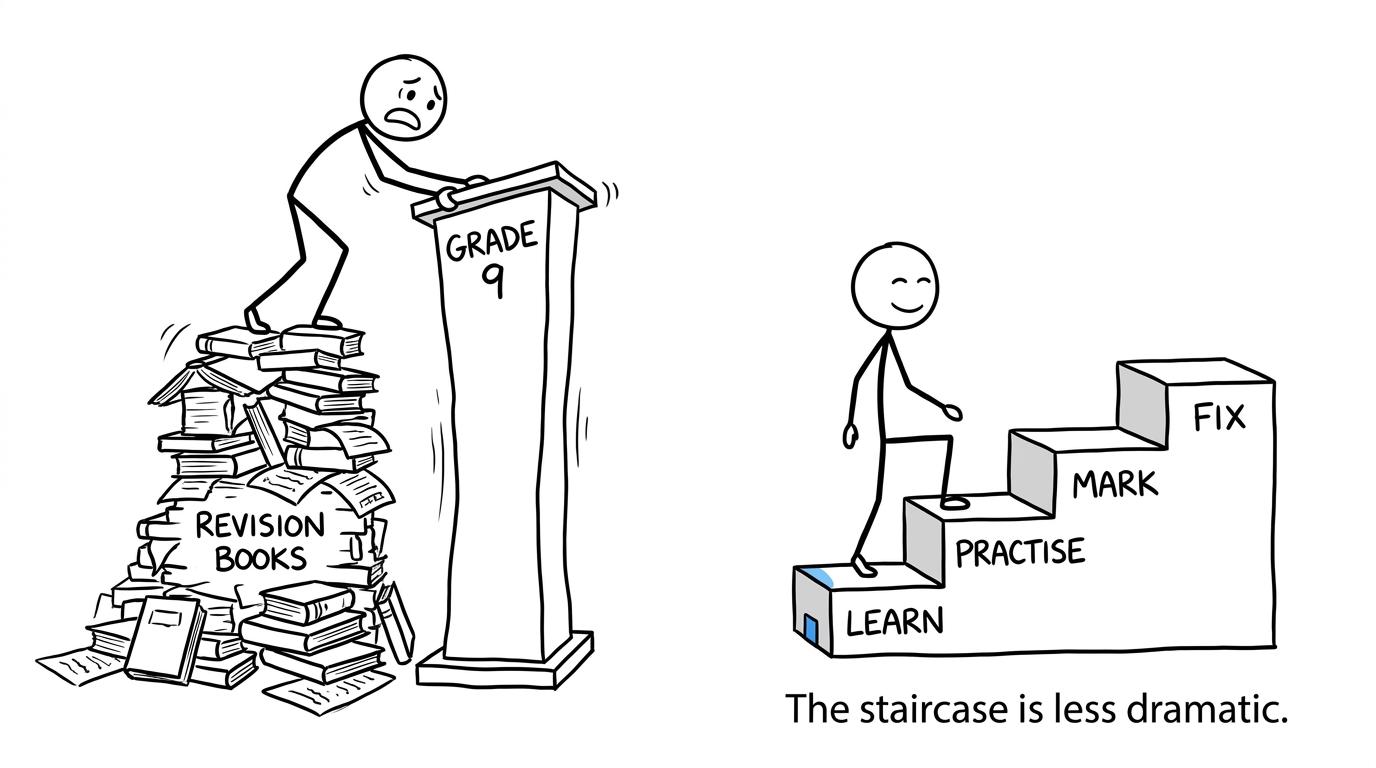 A student chooses a revision staircase instead of climbing a pile of books
Why grade 9 percentages can be misleading
Different cohort sizes
A rate based on 8,4038,4038,403 Latin entries describes a very different assessment population from a rate based on more than 800,000800,000800,000 maths results. Smaller subjects can also show more visible year-to-year movement because each result represents a larger share of the cohort.
Entry patterns are different
Maths is taken by almost everyone in the main GCSE cohort. Latin is not widely available and is generally chosen within particular school settings. Comparing the percentages without recognising this selection effect creates a distorted conclusion.
Board rates are not interchangeable
OCR and Eduqas use different specifications and candidate groups. Their percentages are useful facts, but a higher rate on one board does not establish that its papers were easier.
Grade boundaries change
A grade 9 is not tied permanently to one raw mark. Awarding organisations set boundaries after each series using evidence about the assessments and candidate performance. Historical boundaries can guide revision, but they are not promises about the next examination.
The same principle applies when using Edexcel GCSE maths predicted papers. They provide valuable unseen practice, but they should supplement official past papers rather than become a prediction of your exact result.
Common mistakes when reading the figures
Averaging board percentages directly. OCR and Eduqas have different numbers of candidates, so the combined rate must be weighted by entries.
Confusing grade 9 with grades 9-7. A table headed “top grades” may combine grades 9, 8 and 7. That percentage is much larger than the proportion receiving grade 9 alone.
Treating cumulative percentages as separate grade percentages. Exam-board tables often show the percentage receiving a stated grade or higher. The grade 9 column is straightforward because nothing is above it, but later columns need careful interpretation.
Assuming a high rate means an easy subject. The candidates, availability and entry decisions differ. Difficulty cannot be measured from one outcome percentage alone.
Using national data as a personal forecast. A national rate describes a cohort, not your next result. Your marked answers give better revision information.
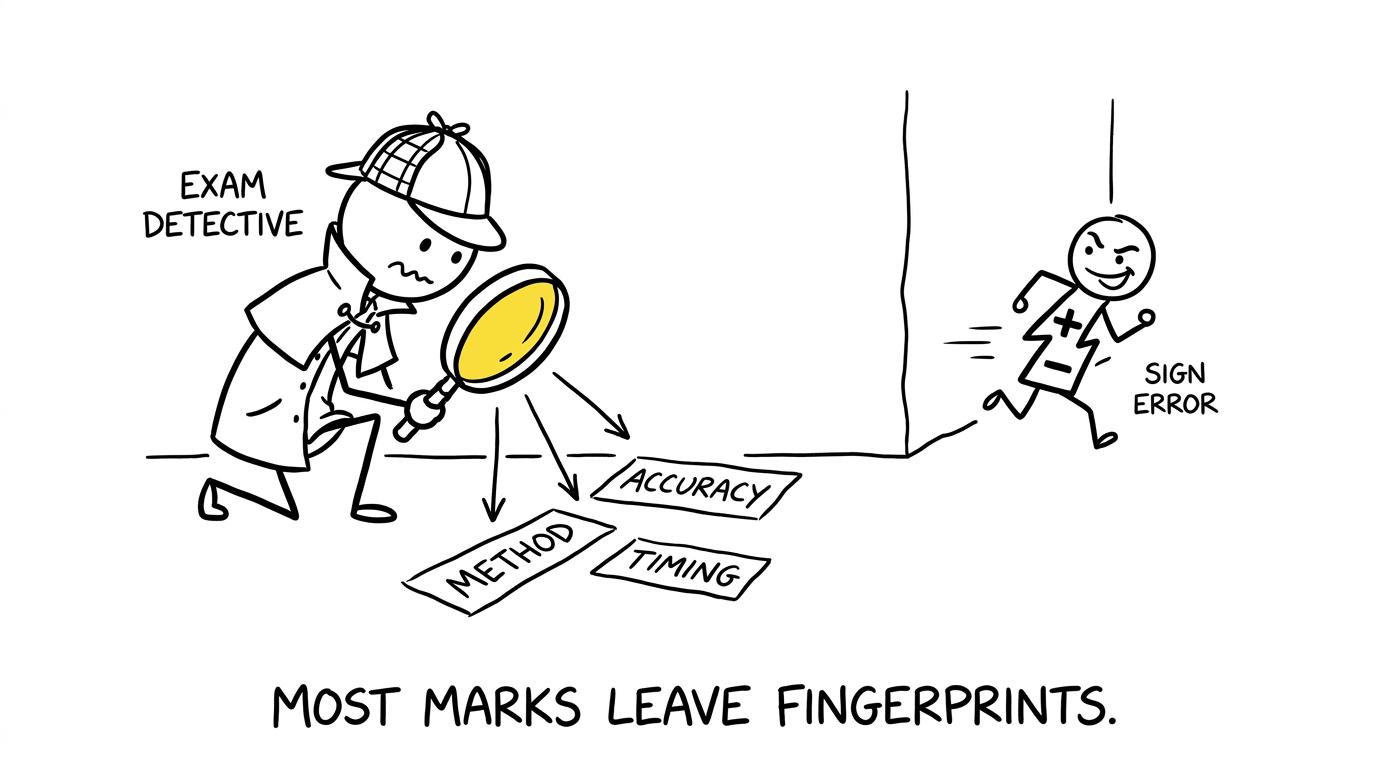 An exam-paper detective follows clues while a sign error escapes
Turn statistics into a better revision decision
The Latin figures tell a clear but limited story: around one-third of entrants achieved grade 9 in each of the last three summer series, compared with roughly one in twenty GCSE entries overall and a smaller share in maths. The difference is real, but much of its meaning sits in the composition and size of the cohorts.
For your own GCSE maths preparation, the useful question is not “How many other students get grade 9?” It is “Which marks can I recover next?”
Start with the free MathsGenie GCSE revision resources, then use short Edexcel mini tests or the equivalent topic practice suited to your board. Build towards timed past-paper practice, checking official mark schemes and worked or video solutions where available.
As the exams approach, add predicted papers to test unfamiliar combinations of skills. MathsGenie's revision lessons, practice questions, mini tests, past papers, predicted papers and mark schemes give you a complete loop: learn, practise, mark, fix and try again. National statistics provide context. Careful revision changes the result in front of you.