GCSE Economics Grade 9 Rate: How Many Achieve It?
GCSE economics grade 9 rate explained using recent results data, annual trends and comparisons with maths, English, business and science GCSEs.
The difference between a grade 888 and a grade 999 can feel enormous when you are waiting for results. Statistically, however, it is a narrow slice of the cohort. The latest GCSE economics grade 9 rate is approximately 7.7%7.7\%7.7%, based on provisional summer 2025 results published by AQA and OCR. That is roughly one grade 999 for every thirteen Economics entries.
Economics therefore has a higher grade 999 rate than GCSE Maths, English Language and Business. But that does not automatically make Economics easier. The students taking each subject, the number of entries and the assessment demands are different.
Here is the useful answer at a glance:
- Around 777 to 888 out of every 100100100 GCSE Economics entries receive grade 999 in a typical recent year.
- In 2025, AQA reported 7.2%7.2\%7.2% at grade 999 and OCR reported 8.0%8.0\%8.0%.
- The combined rate for those two boards was approximately 7.7%7.7\%7.7%.
- Economics had 7,6087{,}6087,608 UK entries in the 2025 JCQ subject data, making it much smaller than Maths or English.
- A grade 999 is uncommon, but the national percentage is not a prediction of your own result.
What is the GCSE economics grade 9 rate?
AQA reported 3,0293{,}0293,029 GCSE Economics candidates in June 2025, with 7.2%7.2\%7.2% achieving grade 999. OCR reported 4,4154{,}4154,415 candidates, with 8.0%8.0\%8.0% achieving grade 999.
Combining the published candidate numbers gives:
3,029+4,415=7,4443{,}029+4{,}415=7{,}4443,029+4,415=7,444Approximately 218218218 AQA candidates and 355355355 OCR candidates achieved grade 999. That produces a combined estimate of:
218+3557,444×100≈7.7%\frac{218+355}{7{,}444}\times 100\approx 7.7\%7,444218+355×100≈7.7%The JCQ UK table records 7,6087{,}6087,608 Economics entries overall. Applying a rate of approximately 7.7%7.7\%7.7% suggests that just under 600600600 Economics entries across the UK received grade 999:
7,608×0.077≈5867{,}608\times 0.077\approx 5867,608×0.077≈586That is an estimate rather than an individual-candidate count from JCQ, because datasets can differ slightly in geographical coverage and reporting categories. The safest headline is therefore about 7.7%7.7\%7.7%, or roughly one in thirteen entries.
 A student and calculator climbing towards a Grade 9 summit
How has the rate changed each year?
Recent grade distributions suggest that the Economics grade 999 share has remained in a relatively narrow range following the return to normal exam grading. Rounded figures are more meaningful than false precision because JCQ, Ofqual and individual boards do not always report identical populations.
| Exam year | Approximate grade 999 share | Sensible interpretation |
|---|---|---|
| 202320232023 | Around 8%8\%8% | Roughly one in twelve or thirteen entries |
| 202420242024 | Around 7%7\%7% | Roughly one in fourteen entries |
| 202520252025 | Around 7.7%7.7\%7.7% | Roughly one in thirteen entries |
Results from 202020202020 to 202220222022 should not be used as a simple benchmark. Qualification outcomes during and immediately after the pandemic were affected by alternative assessment arrangements and transitional grading decisions. For a student sitting exams now, the most recent normally examined series are more informative.
The wider picture also matters. Ofqual reported that, across GCSEs in England in summer 2025, 21.8%21.8\%21.8% of outcomes were at grades 777 to 999. For Economics specifically, JCQ reported approximately 33.1%33.1\%33.1% at grades 777 to 999 across the UK. Economics therefore had a comparatively large proportion of top grades, not just a noticeable grade 999 share.
How Economics compares with other GCSEs
Rounded recent national figures place the Economics grade 999 rate above several large-entry subjects but below some separate sciences. Exact percentages can change each summer, and comparisons may use England-only or UK-wide data, so they should be treated as context rather than a league table of difficulty.
| GCSE subject | Approximate recent grade 999 rate | Comparison with Economics |
|---|---|---|
| Economics | About 7.7%7.7\%7.7% | Reference point |
| Mathematics | About 333 to 4%4\%4% | Lower |
| English Language | About 222 to 3%3\%3% | Lower |
| English Literature | About 333 to 4%4\%4% | Lower |
| Business | About 333 to 4%4\%4% | Lower |
| Computer Science | About 555 to 7%7\%7% | Similar or slightly lower |
| Biology | About 121212 to 13%13\%13% | Higher |
| Chemistry | About 13%13\%13% | Higher |
| Physics | About 131313 to 14%14\%14% | Higher |
These figures do not prove that Physics is easier than Maths, or that Economics is easier than Business. Separate science entrants are a more selected group because many schools enter particular students for Biology, Chemistry and Physics rather than Combined Science. Maths and English, by contrast, are taken by almost the entire GCSE cohort.
Economics is also an optional subject offered by a smaller number of schools. JCQ recorded 7,6087{,}6087,608 UK Economics entries in 2025, compared with more than 800,000800{,}000800,000 Mathematics entries. Comparing the percentages without considering those populations is like comparing the finishing times of two races without noticing that one is open to everyone and the other has a smaller field.
Why the exam board can affect the visible rate
In 2025, AQA's grade 999 rate was 7.2%7.2\%7.2%, while OCR's was 8.0%8.0\%8.0%. That difference does not mean OCR was automatically easier.
Exam boards set grade boundaries after reviewing how demanding each paper was and how the cohort performed. A harder paper may have a lower raw-mark boundary, while an accessible paper may need a higher boundary. Boundaries are not fixed percentages that can be safely predicted before the examinations.
AQA and OCR both assess knowledge, application and analysis or evaluation. Their current GCSE Economics qualifications are linear, with examinations taken at the end of the course. Students should always confirm the correct specification and paper structure with their teacher rather than relying on generic online advice.
The same principle applies in maths. If you are preparing for Edexcel, AQA, OCR or Eduqas, practise material aligned with your board and tier. MathsGenie's GCSE Maths topics by exam board and tier guide can help you check what belongs in your own revision plan.
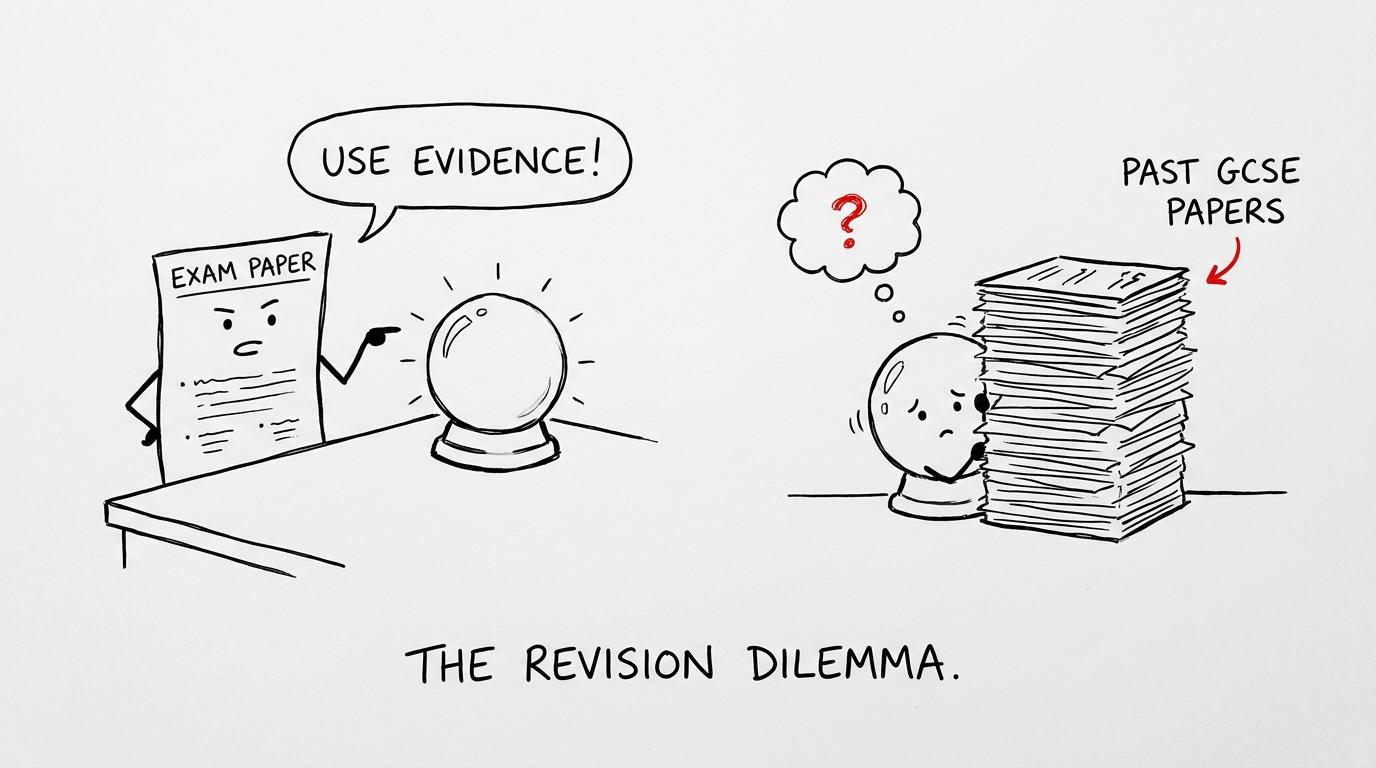 An exam paper tells a crystal ball to use evidence
What the percentage means for your own grade
A national rate describes a cohort. It does not set a personal probability.
If 7.7%7.7\%7.7% of entries achieve grade 999, it is tempting to think every student begins with a 7.7%7.7\%7.7% chance. That is not how the statistic works. Candidates have different levels of preparation, prior attainment, attendance, exam technique and understanding. Your performance is not selected randomly from a hat.
The statistic is useful for perspective: grade 999 is genuinely exceptional. It is not useful as a ceiling on ambition.
The more practical question is whether your work consistently demonstrates the qualities rewarded at the top of the mark scheme. In Economics, that usually means accurate knowledge, confident use of context, interpretation of data, developed chains of reasoning and conclusions that respond directly to the question.
Why maths skills matter in GCSE Economics
Economics is an essay-based subject, but quantitative confidence still matters. Specifications include skills such as percentages, percentage change, ratios, averages, interpreting graphs and using economic data.
These skills are also valuable for your main maths qualification. A percentage change is calculated using:
percentage change=new value−original valueoriginal value×100\text{percentage change}=\frac{\text{new value}-\text{original value}}{\text{original value}}\times 100percentage change=original valuenew value−original value×100Being able to interpret scales, compare rates and explain trends reduces the chance of dropping straightforward marks in Economics. It also strengthens GCSE Maths topics that appear throughout foundation and higher tier papers.
For focused support, use MathsGenie's GCSE Maths revision hub and its topic lessons, practice questions and video solutions. The Edexcel GCSE Statistics revision area is also useful if you want deeper practice with data, averages and graphical interpretation.
A sensible revision checklist for ambitious students
A grade 999 target needs more than repeatedly reading notes. Use a feedback loop:
- Check your Economics specification and identify unfinished content.
- Practise interpreting tables, percentages, indices and graphs without notes.
- Complete timed questions and compare your response with the mark scheme.
- Record whether lost marks came from knowledge, application, analysis, evaluation or timing.
- Reattempt weak question types after a short gap.
- Maintain your quantitative skills through regular GCSE Maths practice.
For maths revision, you can build the same loop using Edexcel GCSE Maths past papers, AQA GCSE Maths past papers or OCR GCSE Maths past papers. Sit the correct tier under timed conditions, mark it strictly and return to the lessons connected with every lost mark.
Near the examination period, GCSE predicted papers can provide additional unfamiliar practice. They work best after you have repaired known weaknesses, not as a replacement for the specification or official past papers.
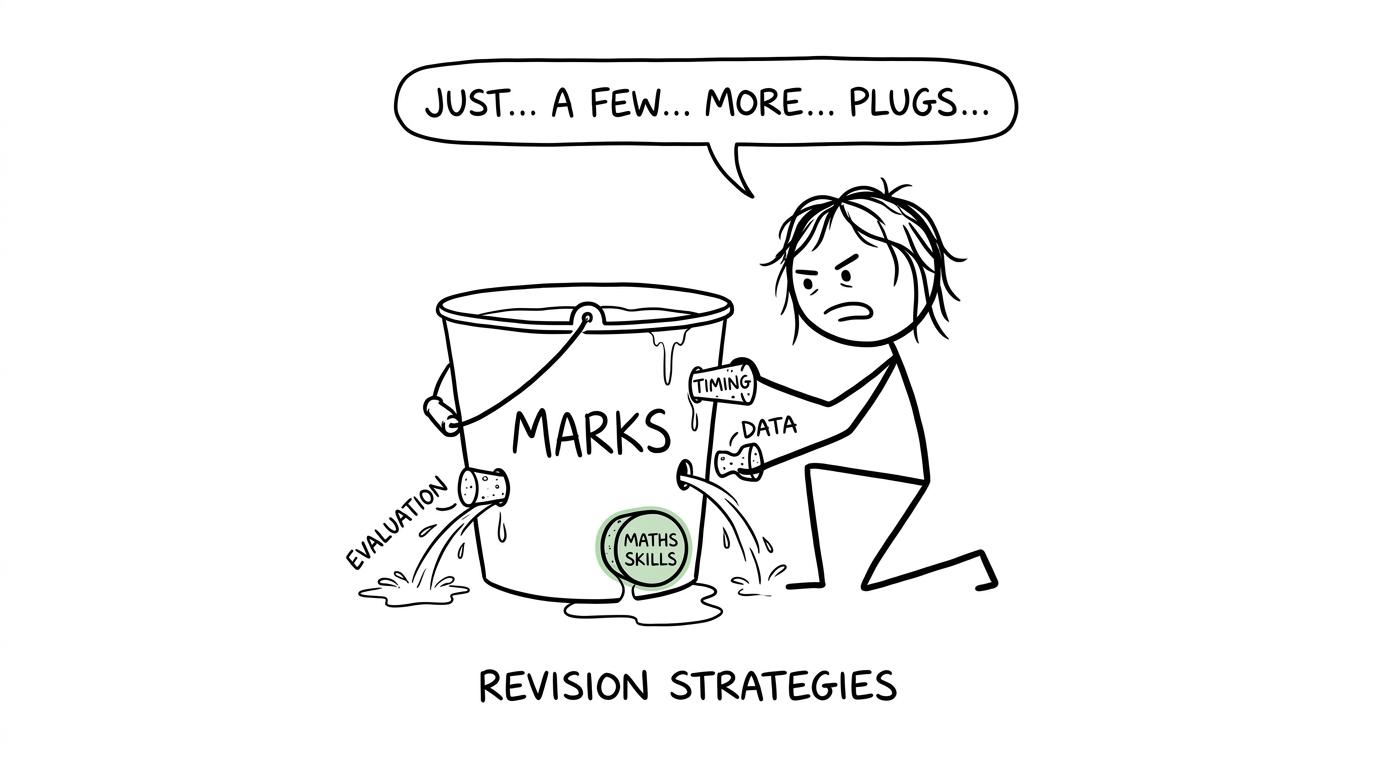 A student plugging leaks in a bucket of exam marks
Common mistakes when interpreting grade statistics
Confusing grade 999 with grades 777 to 999
A headline may report the proportion receiving a grade 777 or above. That is a cumulative figure covering grades 777, 888 and 999, not the grade 999 rate alone. In 2025, about 33.1%33.1\%33.1% of UK Economics entries achieved grades 777 to 999, while only about 7.7%7.7\%7.7% achieved grade 999.
Treating entries as individual students
Published tables usually count qualification entries. A student taking ten GCSEs contributes ten outcomes to an all-subject distribution. Subject tables are clearer, but technically describe Economics entries rather than every aspect of the students themselves.
Assuming a higher rate means an easier subject
Entry policies, cohort ability, school provision and assessment design all affect outcomes. A high grade 999 percentage cannot isolate paper difficulty.
Using old boundaries as a target
Grade boundaries change after each examination series. Past boundaries can help you interpret practice papers, but they cannot guarantee the marks required in a future series.
Comparing school data with national data
One school may have a particularly small or academically selected Economics class. Its percentage can move dramatically because of only one or two results. National data provides a broader benchmark.
A rare result is still a practical target
The latest evidence puts the GCSE Economics grade 999 rate at about 7.7%7.7\%7.7%. That makes grade 999 unusual, though not mysterious: roughly one in thirteen entries reached it in 2025. The rate is higher than in Maths, English Language and Business, but lower than in several separate sciences.
Statistics tell you how rare an outcome was. Revision determines how prepared you are to pursue it.
For the maths skills supporting Economics and your wider GCSE programme, make MathsGenie your revision base. Start with free revision lessons and practice questions, test yourself with mini tests, then move into past papers, mark schemes, video solutions and predicted papers. If you need a clear timetable, follow the GCSE one-month maths revision plan and turn every lost mark into a specific next action.