Cubic Graphs Exam Questions: GCSE Guide
Cubic graphs exam questions explained through three GCSE examples, method-mark guidance, common mistakes and focused practice for your next paper.

Cubic graphs can look more complicated than they are. The curve changes direction, coordinates may include negative numbers, and an answer sometimes has to be read from a graph rather than calculated exactly.
The reliable way to answer cubic graphs exam questions is to separate the task into small decisions: identify the shape, calculate coordinates carefully, plot accurately and interpret intersections. The three GCSE examples below show how these decisions work and where clear working can earn credit. Imagine a student, Maya, working through them.
Your cubic graphs checklist
Check what the command word requires:
- Recognise: identify the cubic from its overall shape.
- Sketch: show the orientation, intercepts and important features without a perfectly scaled graph.
- Plot: calculate coordinates, use the stated scale and draw a smooth curve.
- Solve graphically: draw any additional line required and read the intersections.
- Interpret: connect coordinates to the equation or context.
A cubic function has a highest power of 333. The simplest example is
y=x3.y=x^3.y=x3.It passes through the origin and increases from bottom left to top right. A negative leading term, as in y=−x3y=-x^3y=−x3, reverses that orientation.
The Drawing Other Graphs: Cubic and Reciprocal lesson brings the shapes, video explanation and practice resources together.
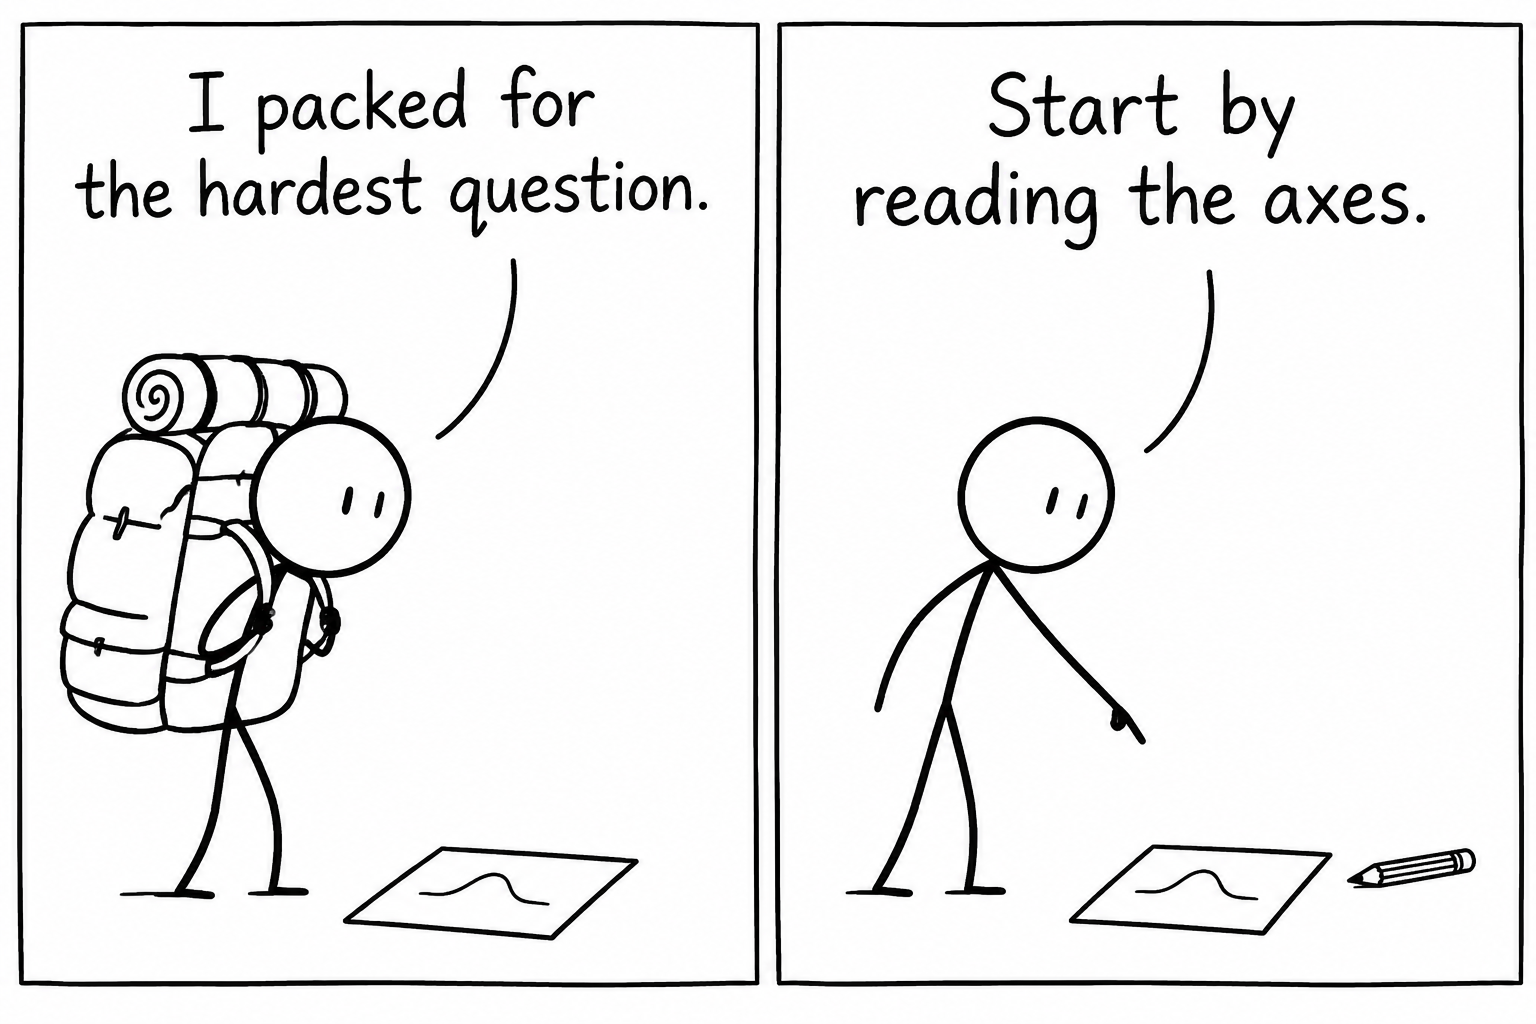 A student overprepares for a cubic graph while a classmate suggests reading the axes first
Question one: recognising and sketching a cubic graph
Consider this exam-style instruction:
Sketch the graph of y=x3y=x^3y=x3 for −2≤x≤2-2\leq x\leq 2−2≤x≤2.
Maya notices sketch. She does not need a full table, but she needs the defining features.
Three useful coordinates are:
(−1,−1),(0,0),(1,1).(-1,-1),\qquad (0,0),\qquad (1,1).(−1,−1),(0,0),(1,1).She draws a smooth curve rising from the bottom left, flattening as it crosses the origin, then continuing towards the top right. The sketch should cover the requested interval.
Marking points may reward the correct orientation, passing through (0,0)(0,0)(0,0) and a smooth, continuous shape. Exact marking varies by paper.
She does not add a turning point: y=x3y=x^3y=x3 has no maximum or minimum. The lesson is to check the leading coefficient and intercepts rather than relying on a remembered shape alone.
Question two: completing a table and plotting
The next question requires accurate calculation:
Complete the table for y=x3−4xy=x^3-4xy=x3−4x, then draw the graph for −3≤x≤3-3\leq x\leq 3−3≤x≤3.
For x=−3x=-3x=−3,
y=(−3)3−4(−3)=−27+12=−15.y=(-3)^3-4(-3)=-27+12=-15.y=(−3)3−4(−3)=−27+12=−15.Brackets make the negative signs easier to handle. For x=−2x=-2x=−2,
y=(−2)3−4(−2)=−8+8=0.y=(-2)^3-4(-2)=-8+8=0.y=(−2)3−4(−2)=−8+8=0.Continuing gives:
| xxx | −3-3−3 | −2-2−2 | −1-1−1 | 000 | 111 | 222 | 333 |
|---|---|---|---|---|---|---|---|
| yyy | −15-15−15 | 000 | 333 | 000 | −3-3−3 | 000 | 151515 |
Maya plots each coordinate, including the three intercepts:
(−2,0),(0,0),(2,0).(-2,0),\qquad (0,0),\qquad (2,0).(−2,0),(0,0),(2,0).She checks both axes before drawing one smooth curve through the points. Unlike y=x3y=x^3y=x3, this graph has two turning points.
Potential marking opportunities include correct table entries, accurately plotted coordinates and a suitable curve. Follow-through credit depends on the particular mark scheme, so never assume an incorrect value will receive further marks. Keep calculations visible and check unexpected points before drawing.
Use the GCSE Maths Question Bank to practise the method with different expressions and scales.
Checking a cubic graph before moving on
A thirty-second check can protect several marks. First, substitute x=0x=0x=0 to confirm the yyy-intercept. Next, look for symmetry. For y=x3−4xy=x^3-4xy=x3−4x, replacing xxx with −x-x−x changes the sign of the output, so coordinates occur in opposite pairs. If (1,−3)(1,-3)(1,−3) is present, then (−1,3)(-1,3)(−1,3) should also appear. This is a useful check, not a substitute for calculation.
Then compare the ends of the graph with the leading term. Because x3−4xx^3-4xx3−4x has a positive x3x^3x3 term, its overall path runs from bottom left to top right. Finally, remember that turning points sit between plotted coordinates unless a calculation shows otherwise. A table does not necessarily give their exact locations.
Question three: solving an equation graphically
Now consider:
The graph of y=x3−x−1y=x^3-x-1y=x3−x−1 has been drawn. By drawing a suitable straight line, solve x3−x−2=0x^3-x-2=0x3−x−2=0. Give your answer to 111 decimal place.
The crucial step is connecting the equation to the supplied graph. Rewrite
x3−x−2=0x^3-x-2=0x3−x−2=0as
x3−x−1=1.x^3-x-1=1.x3−x−1=1.The left side matches the given curve, so Maya draws
y=1.y=1.y=1.The intersection's xxx-coordinate gives the solution:
x≈1.5x\approx1.5x≈1.5to 111 decimal place. The root is near 1.521.521.52, making this a sensible graphical answer.
Possible marking points include identifying the correct line, drawing it accurately and reading the intersection within the accepted tolerance.
Drawing y=2y=2y=2 would solve a different equation. Giving the intersection's yyy-coordinate would answer 111, the line's height rather than the required value of xxx.
When reading an intersection, use a sharp pencil and trace carefully to the relevant axis. Check how many small squares represent one unit before deciding the final decimal. The graph controls the realistic accuracy of the answer.
Find further topic-based practice in the GCSE exam booklets. The Edexcel GCSE revision page places graph skills within the wider algebra course.
Approaching cubic graphs past paper questions
Wording changes, but the underlying decisions remain stable:
- Identify whether you must sketch, plot or solve.
- Write the equation represented by the given curve.
- Substitute negative values using brackets.
- Check axis scales before plotting.
- Draw smoothly across the requested interval.
- State any additional line before drawing it.
- Read the requested coordinate to the stated accuracy.
Do not round intermediate readings unnecessarily. A correct line can still lead to an inaccurate answer if you misread the scale. For shorter practice sessions, use GCSE Question Rush to check recognition before attempting longer questions.
Common mistakes in cubic graphs exam questions
Joining points with straight lines
A cubic is a smooth curve, not connected straight segments. Check any point that makes the shape look unexpectedly jagged.
Losing negative signs
Remember that (−2)3=−8(-2)^3=-8(−2)3=−8, not 888. Put negative inputs in brackets when using a calculator.
Assuming every cubic looks identical
The graph of y=x3y=x^3y=x3 always increases, whereas y=x3−4xy=x^3-4xy=x3−4x has two turning points. Let the equation and coordinates guide the shape.
Reading the wrong coordinate
For an equation in xxx, read the intersection's xxx-coordinate by tracing vertically to the horizontal axis.
Hiding the method
Show substitutions, label additional lines and mark intersections clearly. Visible working makes your reasoning easier to assess.
Turn the method into reliable practice
Confidence comes from repeating a reliable process, not memorising one picture. Try a question independently, compare your working with the mark scheme, then redo the step that caused difficulty.
Start with MathsGenie's free cubic graphs revision lesson, then tackle unfamiliar questions. Each checked calculation and carefully read intersection makes the next graph less uncertain.