Question 37
The partially completed histogram and the partially completed table below show the times taken, to the nearest second, by a group of people to complete a puzzle. The two bars shown are drawn accurately, and the vertical axis has no scale marked on it.
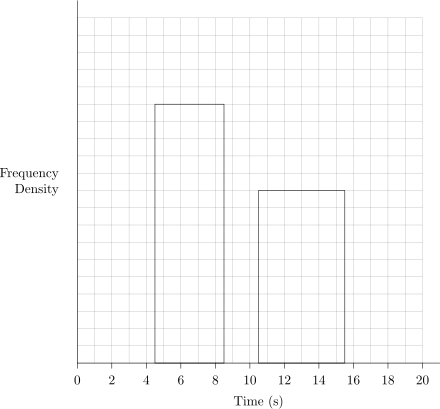
| Time (seconds) | Frequency |
|---|---|
| 1–4 | 2 |
| 5–8 | 12 |
| 9–10 | 8 |
| 11–15 | |
| 16–20 | 3 |
a.[2]
Complete the table.
b.[2]
Find the heights, in terms of frequency density, of the three bars that are missing from the histogram.
c.[2]
One of the participants is selected at random. Estimate the probability that this participant completed the puzzle in under 10 seconds.
2.2 L: Data presentation and interpretation Questions
244 exam-style questions on AQA A Level Maths 2.2 L: Data presentation and interpretation, covering 2.2.1 Single-variable data diagrams, 2.2.2 Scatter diagrams and correlation, 2.2.3 Central tendency, variation and standard deviation, 2.2.4 Outliers and cleaning data, and 2.2 L: Data presentation and interpretation. Each one has a worked solution and a mark scheme showing where the marks go.