Question 9
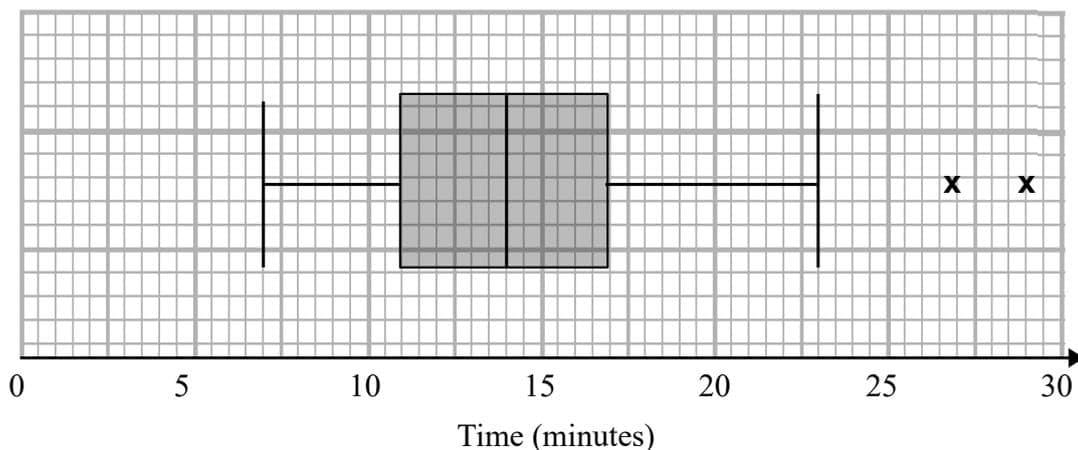
Children from two schools A and B took part in a competition to complete a puzzle. The distribution of times taken, to the nearest minute, by children in school A are shown in the box plot below.
a.[1]
Write down the time by which 75% of the children in school A had completed the puzzle.
b.[2]
State what the two crosses (x) represent on the box plot above. Interpret these in context.
c.[4]
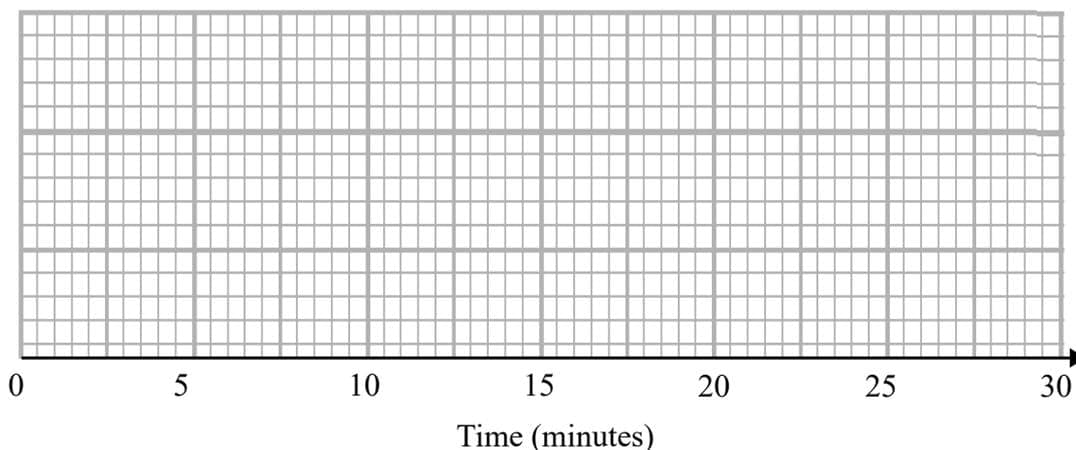
For school B the shortest time taken was 6 minutes, the longest time taken was 22 minutes and the quartiles were 12, 15 and 17 minutes respectively. A value that is greater than Q3+1.5×(Q3−Q1)Q_3 + 1.5 \times (Q_3 - Q_1)Q3+1.5×(Q3−Q1) or smaller than Q1−1.5×(Q3−Q1)Q_1 - 1.5 \times (Q_3 - Q_1)Q1−1.5×(Q3−Q1) is defined as an outlier. Determine if there are any outliers.
d.[3]
Draw a box plot for this information.
e.[3]
Compare the two distributions.
2.2 L: Data presentation and interpretation Questions
244 exam-style questions on AQA A Level Maths 2.2 L: Data presentation and interpretation, covering 2.2.1 Single-variable data diagrams, 2.2.2 Scatter diagrams and correlation, 2.2.3 Central tendency, variation and standard deviation, 2.2.4 Outliers and cleaning data, and 2.2 L: Data presentation and interpretation. Each one has a worked solution and a mark scheme showing where the marks go.