Skip to content
MathsGenie logo
Quick links
Open app

Course home

  1. A Level
  2. Economics Edexcel A
  3. Question bank

2.5 Economic growth

EasyMediumHard
12345678910111213141516171819202122232425262728293031323334
Question 24

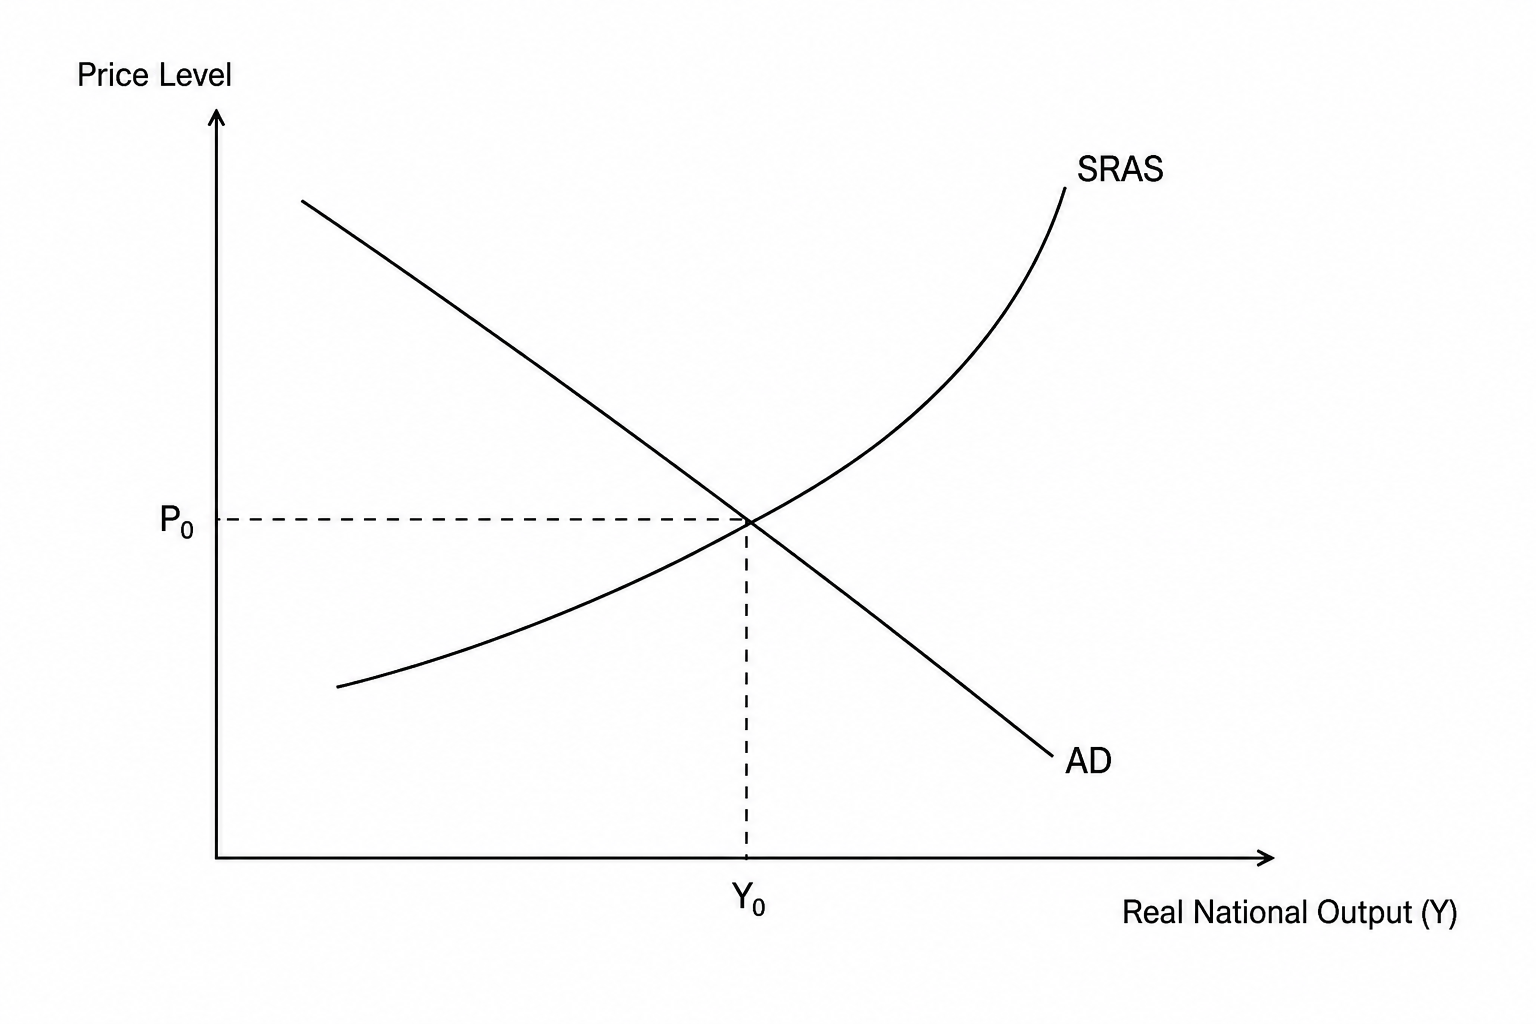
Illustrate a negative (recessionary) output gap on the diagram below by drawing and labeling a Long-Run Aggregate Supply (LRAS) curve.

An AS-AD model diagram with Price Level on the vertical axis and Real National Output (Y) on the horizontal axis.

[1]

2.5 Economic growth Questions

  1. A Level
  2. /Economics
  3. /2.5 Economic growth