With reference to Figure 1 and Extract A, explain two likely reasons why the growth of Finland's real GDP per capita at PPPs was slower than that of Sweden after 2016.
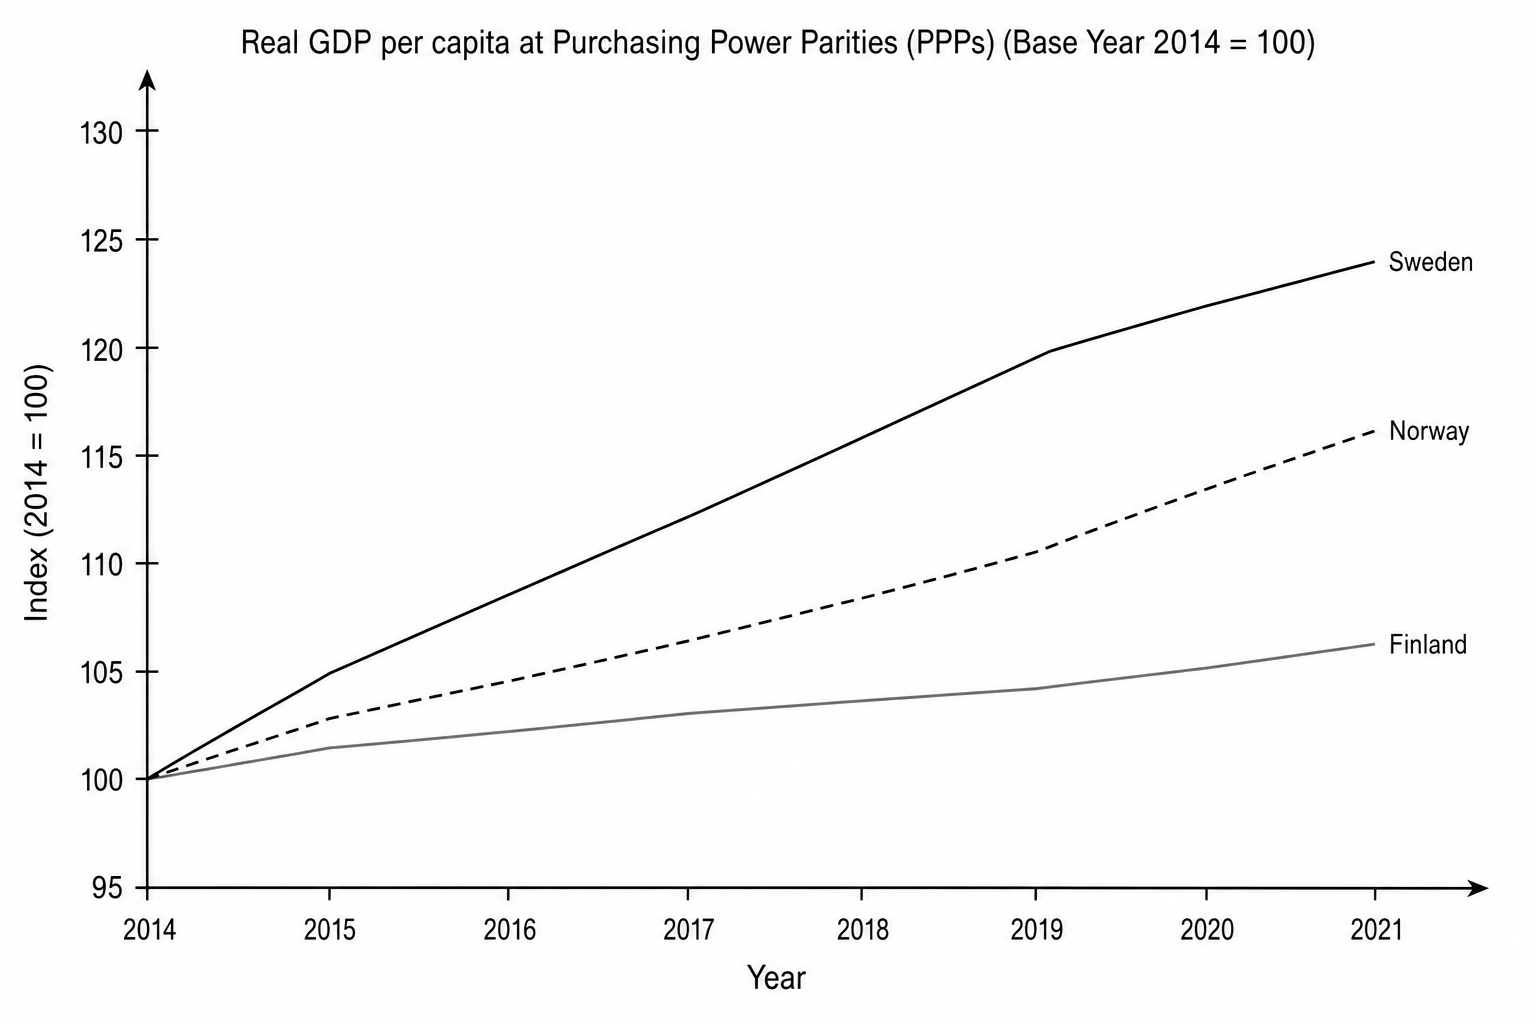
| Year | Norway (Dashed) | Sweden (Solid Black) | Finland (Solid Grey) |
|---|---|---|---|
| 2014 | 100 | 100 | 100 |
| 2015 | 103 | 105 | 101 |
| 2016 | 105 | 108 | 102 |
| 2017 | 107 | 112 | 103 |
| 2018 | 109 | 116 | 104 |
| 2019 | 111 | 120 | 104 |
| 2020 | 113 | 122 | 105 |
| 2021 | 116 | 124 | 106 |
In late 2020, the Ministry of Finance noted that while Finland's aggregate output had stabilized, deep-seated structural rigidities were holding back sustainable per capita improvements.
While overall GDP has shown moderate recovery, performance measured per capita has been disappointing. Although structural unemployment has shown signs of easing, business productivity growth and domestic capital investment have largely stagnated.
Several macroeconomic concerns persist. The trade balance remains under pressure, driven by a long-term erosion in industrial competitiveness and slow growth in high-tech manufacturing exports. In 2016, the government initiated an ambitious project to expand clean-tech and bio-economy exports by 5.0% annually. However, actual export growth in these sectors has averaged only 1.8% per year. The high-tech manufacturing sector has also failed to recover from its historic structural transition, with total output remaining 4.8% below its pre-2015 peak.
Furthermore, a high tax wedge on labour and corporate earnings has discouraged private investment. Business capital investment fell by 4.8% relative to its 2015 peak, limiting the deployment of new physical capital and technology.
Crucial to Finland’s slower growth path is its persistent labour productivity gap. In 2019, Finland’s labour productivity was nearly 12 percentage points lower than Sweden's. Economists suggest that resolving this divergence requires comprehensive structural reforms: relaxing centralized collective wage agreements to make labour markets more flexible, reforming corporate capital depreciation rules to incentivize business R&D, and ramping up adult vocational retraining programs in emerging digital fields.

