A sample of dinitrogen tetroxide gas, N2O4(g)\text{N}_2\text{O}_4(\text{g})N2O4(g), is maintained in a closed, rigid container. Curve X in the diagram represents the Maxwell–Boltzmann distribution of molecular kinetic energies at 298 K.
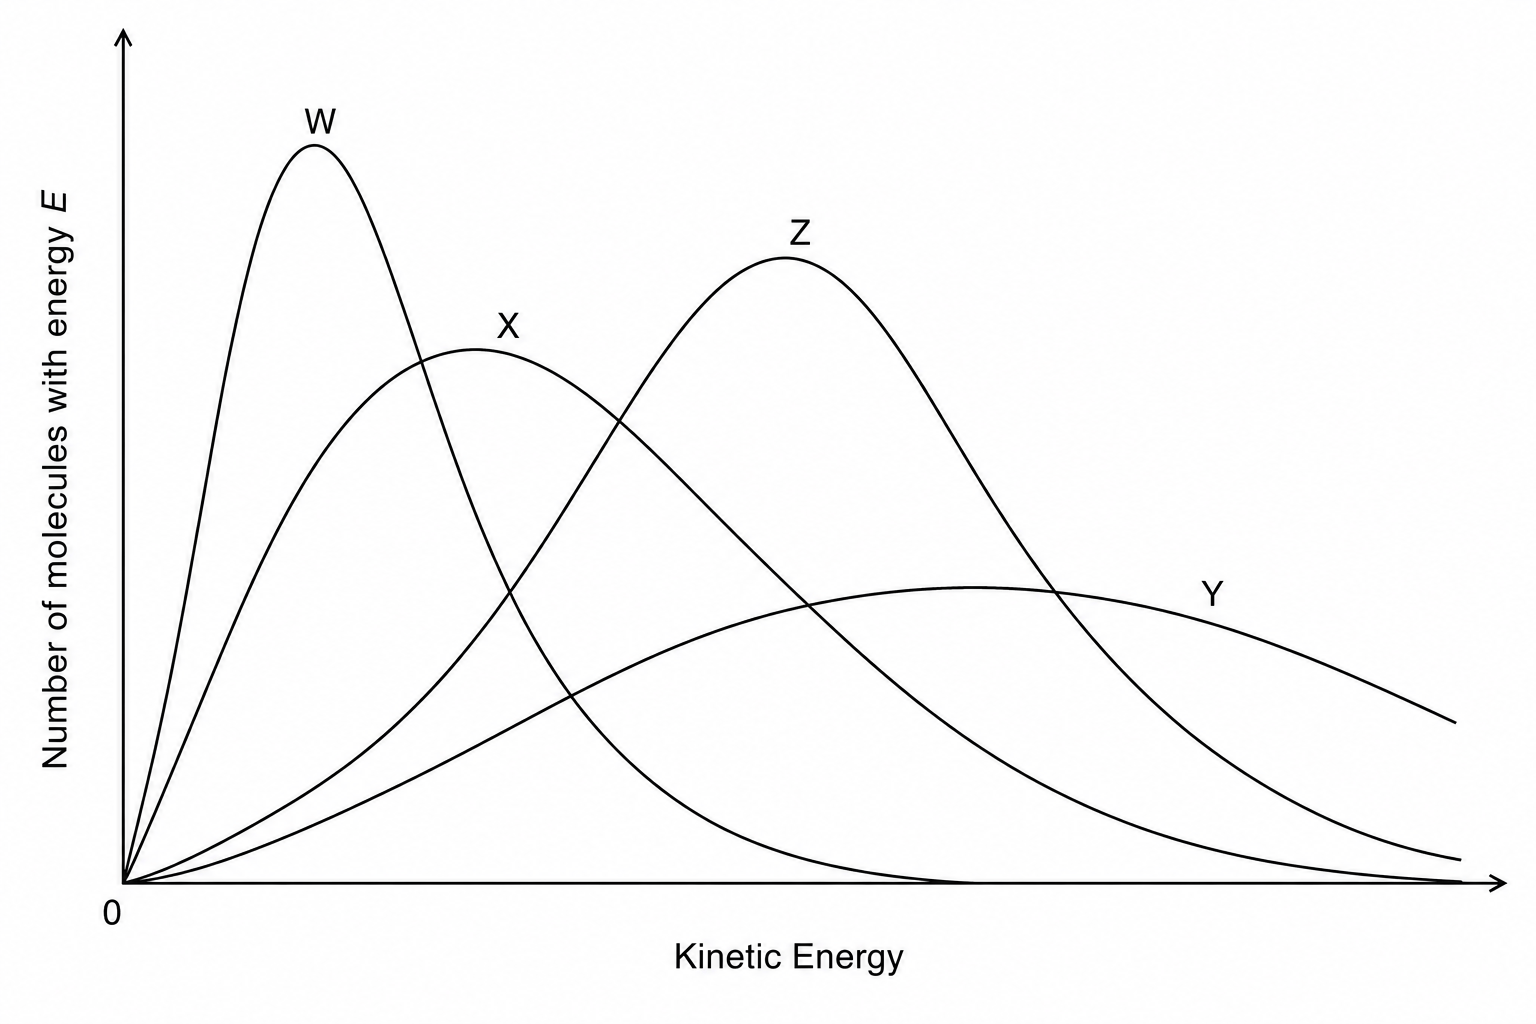
If the temperature of the sample is raised to 325 K, which curve correctly represents the new distribution of molecular kinetic energies?
Curve W
Curve Y
Curve Z
Curve X itself

