Skip to content
MathsGenie logo
Open app

Course home

  1. A Level
  2. Biology OCR A
  3. Question bank

Analysis

EasyMedium
123456789101112131415161718192021222324252627282930313233343536373839404142434445464748
Question 40

Peak expiratory flow (PEF) is a measure of the maximum rate at which a person can exhale.

The graph below shows the typical PEF values for men of different ages and heights.
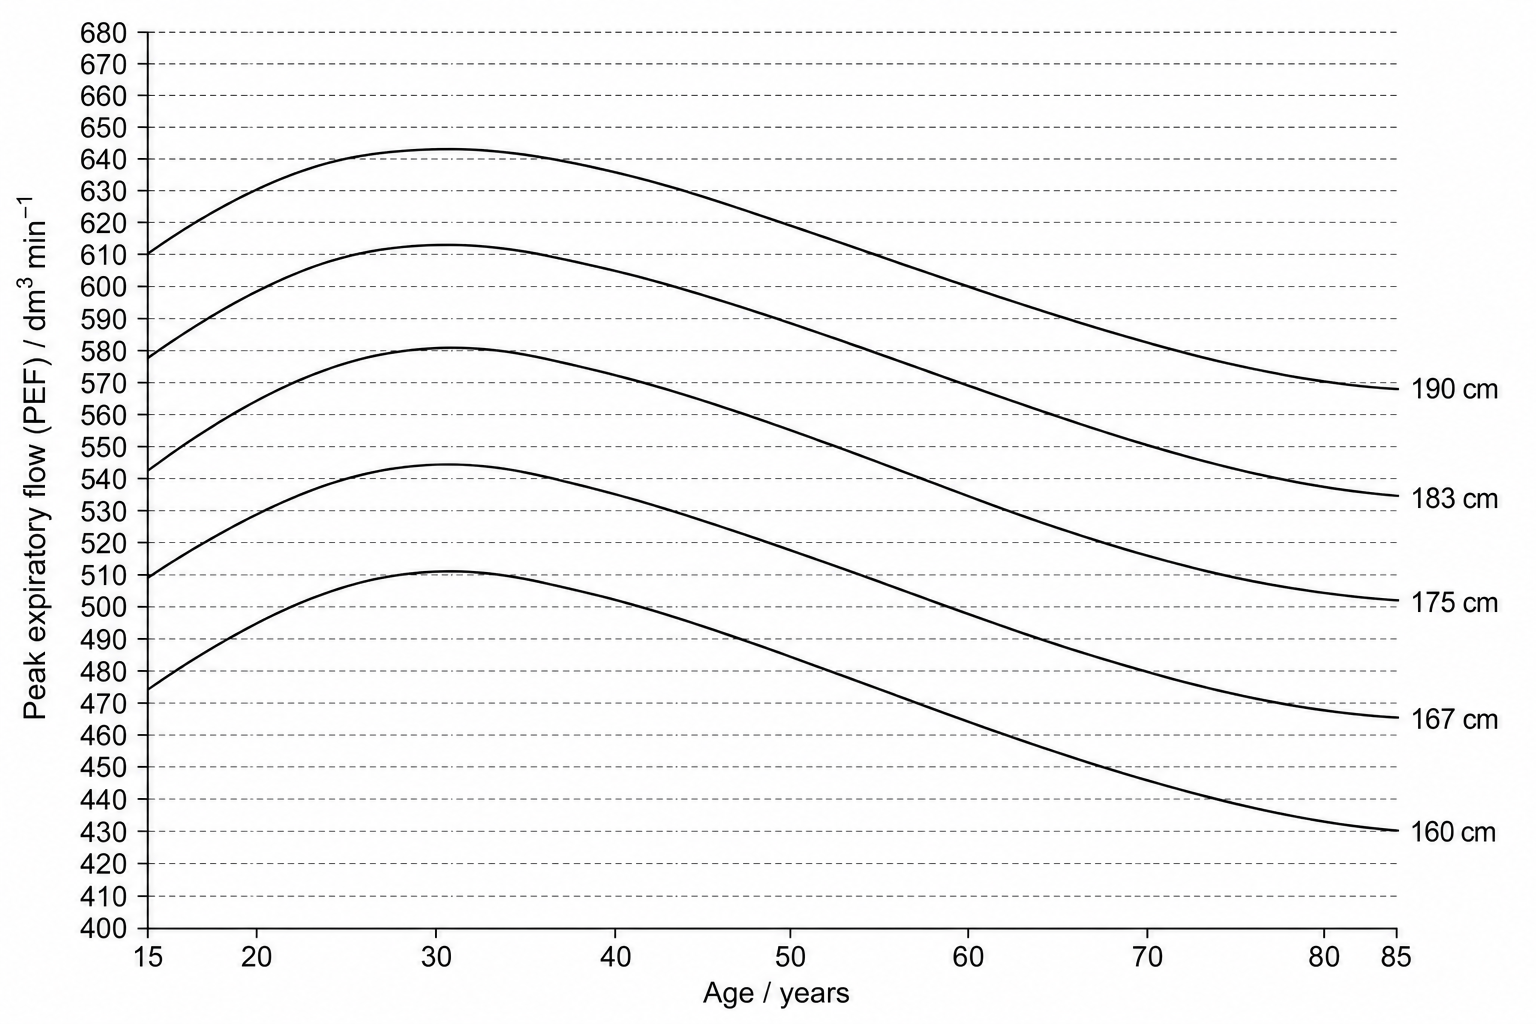
Graph of typical peak expiratory flow (PEF) on the y-axis ranging from 400 to 680 \text{ dm}^3\text{ min}^{-1} (with horizontal grid lines spaced by 10 units), plotted against age in years on the x-axis ranging from 15 to 85 years. Five curves are shown corresponding to heights (from top to bottom): 190 cm, 183 cm, 175 cm, 167 cm, and 160 cm. For a 25-year-old on the 190 cm curve, the PEF is 640 \text{ dm}^3\text{ min}^{-1}. For a 60-year-old on the 175 cm curve, the PEF is 520 \text{ dm}^3\text{ min}^{-1}.

Determine the percentage decrease from the PEF of a 25-year-old man of height 190 cm to the PEF of a 60-year-old man of height 175 cm. Give your answer to one decimal place.


[5]

Analysis Questions

  1. A Level
  2. /Biology
  3. /Analysis