Question 8
80%John draws a graph to show the amount of petrol his car used on a 250 mile journey.
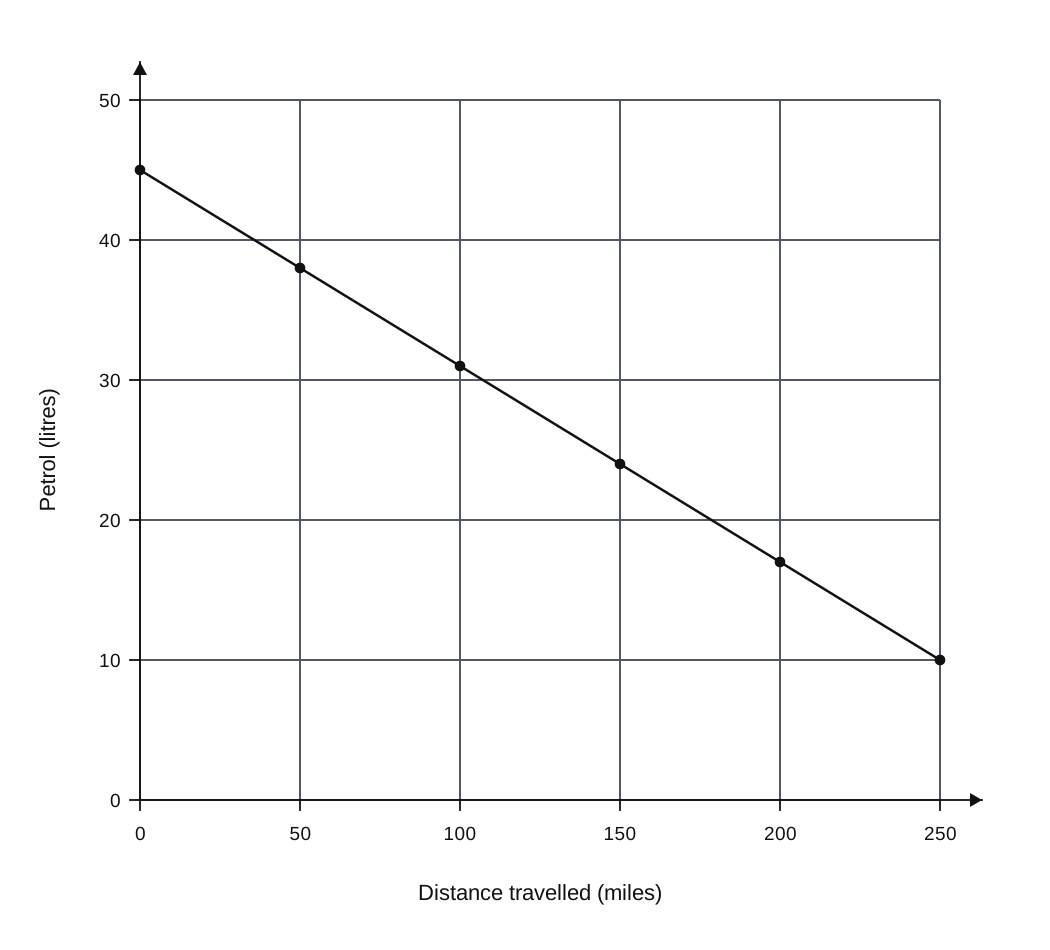
| Distance travelled (miles) | Petrol (litres) |
|---|---|
| 0 | 45 |
| 50 | 38 |
| 100 | 31 |
| 150 | 24 |
| 200 | 17 |
| 250 | 10 |
a.[1]
How much petrol was in John's car at the start of his journey?
b.[1]
How many more miles can John's car travel before it runs out of petrol?
c.[1]
What assumption have you made to calculate your answer to (b)?
Real Life and Distance Time Graphs Questions
14 exam-style questions on Oxford AQA IGCSE Maths Real Life and Distance Time Graphs. Each one has a worked solution and a mark scheme showing where the marks go.