Question 6
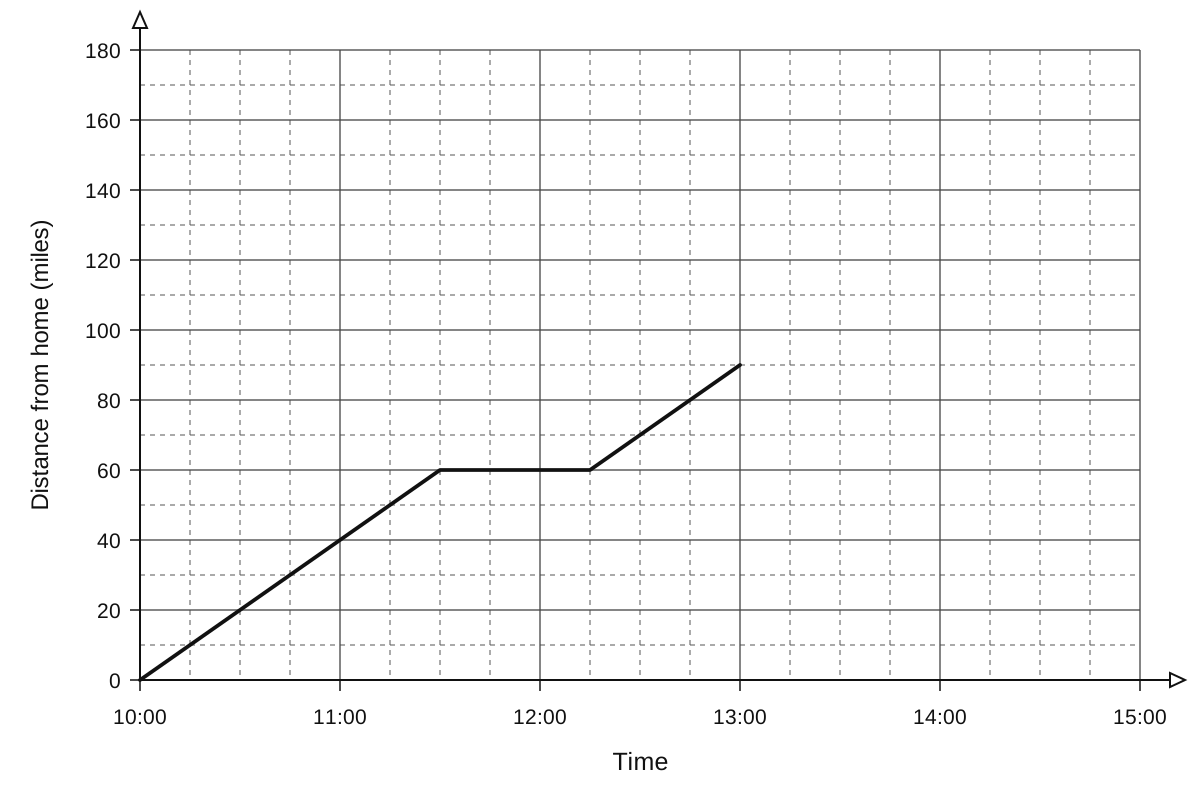
Maya drove from her home to her office in another city. She made one stop for coffee.
Here is part of Maya's travel graph.
a.[1]
For how many minutes did Maya stop for coffee?
b.[2]
What was Maya's average speed between her home and the coffee stop?
c.[2]
Maya's office is 150 miles from her home. Maya arrived at her office at 14 30.
Complete the graph.
Real Life and Distance Time Graphs Questions
14 exam-style questions on Oxford AQA IGCSE Maths Real Life and Distance Time Graphs. Each one has a worked solution and a mark scheme showing where the marks go.