Real Life and Distance Time Graphs
1
Medium69%
0/3

Rebecca went on a bike ride. This graph shows Rebecca's distance from home on her bike ride.
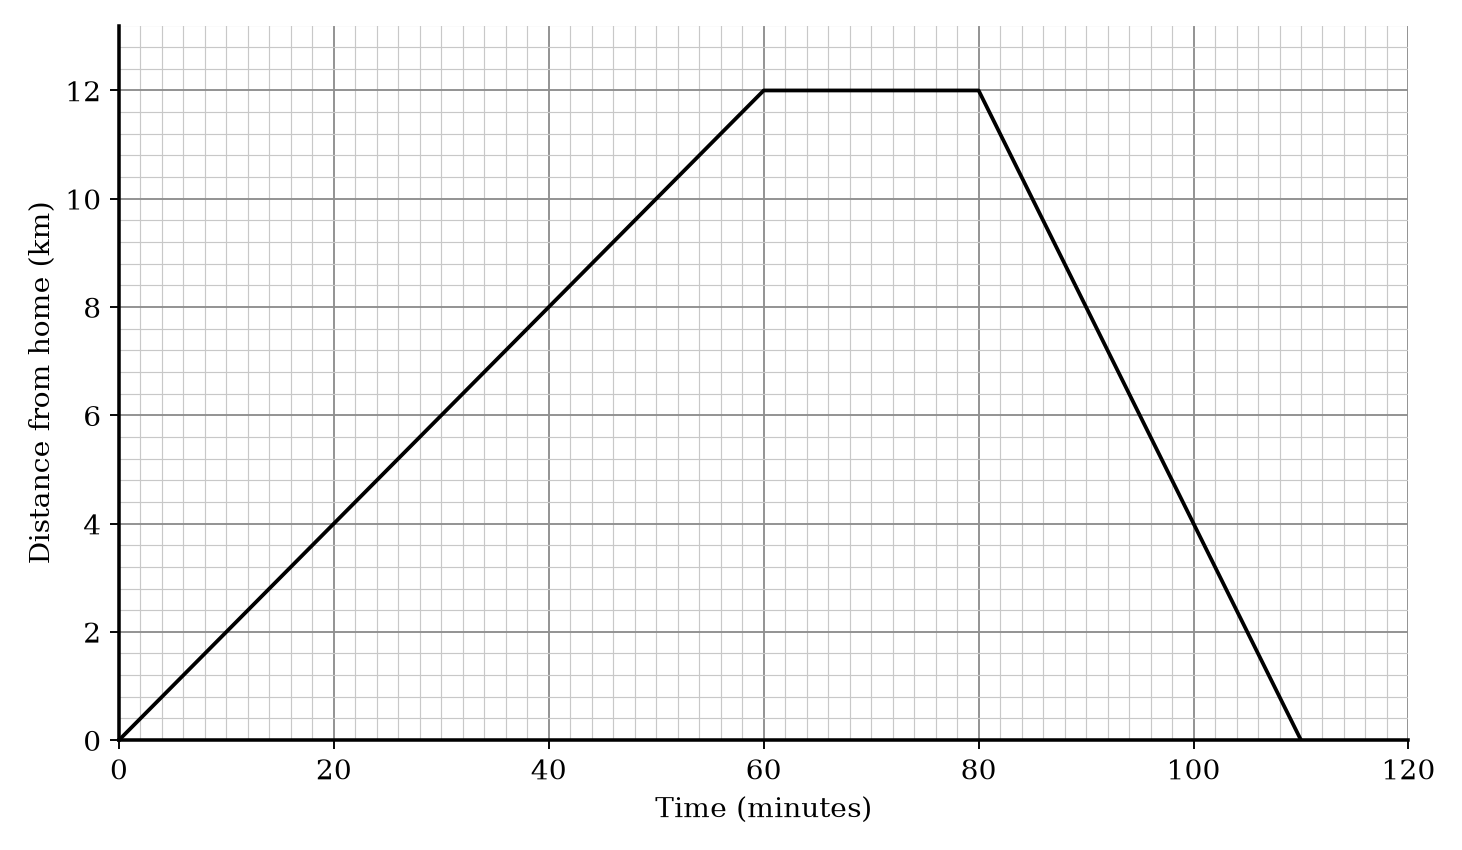
Distance-time graph for a bike ride. The y-axis is 'Distance from home (km)' from 0 to 12. The x-axis is 'Time (minutes)' from 0 to 120. The graph consists of three straight line segments: (0,0) to (60,12), (60,12) to (80,12), and (80,12) to (110,0).

Time (minutes)Distance from home (km)
00
306
6012
8012
1100

Distance-time graph for a bike ride. The y-axis is 'Distance from home (km)' from 0 to 12. The x-axis is 'Time (minutes)' from 0 to 120. The graph consists of three straight line segments: (0,0) to (60,12), (60,12) to (80,12), and (80,12) to (110,0).

a.

How far had Rebecca travelled after 30 minutes?

[1]
b.

After 60 minutes, Rebecca stopped for a rest. For how many minutes did she rest?

[1]
c.

How far did Rebecca travel in total?

[1]

Real Life and Distance Time Graphs Questions

Practise Oxford AQA IGCSE Maths Real Life and Distance Time Graphs with exam-style questions for Core and Extended tier. 21 questions, matched to the Oxford AQA IGCSE Maths (9260) specification and written in Paper 1 and Paper 2 (Core: 1C and 2C; Extension: 1E and 2E) style. Every question includes a full worked solution and mark scheme, so you can see where marks are awarded rather than just whether you got the answer right.

Next

Real Life and Distance Time Graphs Questions

  1. IGCSE
  2. /Maths
  3. /Real Life and Distance Time Graphs