

What you'll learn
- The names of the main trophic levels: producers, consumers and decomposers.
- How to read food chains and food webs using arrows correctly.
- How pyramids of number, biomass and energy transfer represent feeding relationships.
- Why only about 10% of energy is passed from one trophic level to the next.
The basic idea: organisms need food
In an ecosystem, organisms are linked by feeding. Food provides substances for growth and repair, and chemical energy for life processes.
Most ecosystems start with light energy from the Sun. Green plants and algae use photosynthesis to make glucose, storing energy in the chemicals that form their biomass.
Trophic level
A trophic level is the position an organism occupies in a food chain, based on how it obtains its food.
Trophic levels
Producers
A producer is an organism that makes its own food, usually by photosynthesis. Green plants and algae are producers.
Producers are always trophic level 1 because they bring energy into the food chain.
Consumers
A consumer is an organism that obtains energy by eating other organisms.
- A primary consumer eats producers. It is trophic level 2.
- A secondary consumer eats primary consumers. It is trophic level 3.
- A tertiary consumer eats secondary consumers. It is trophic level 4.
Decomposers
A decomposer is an organism, such as a bacterium or fungus, that breaks down dead organisms and waste material. Many decomposers feed by saprotrophic nutrition: they secrete enzymes onto dead material, digest it outside their bodies, then absorb the soluble products.
The diagram below shows how trophic levels, decomposers and mineral ions link together in a simple feeding relationship.
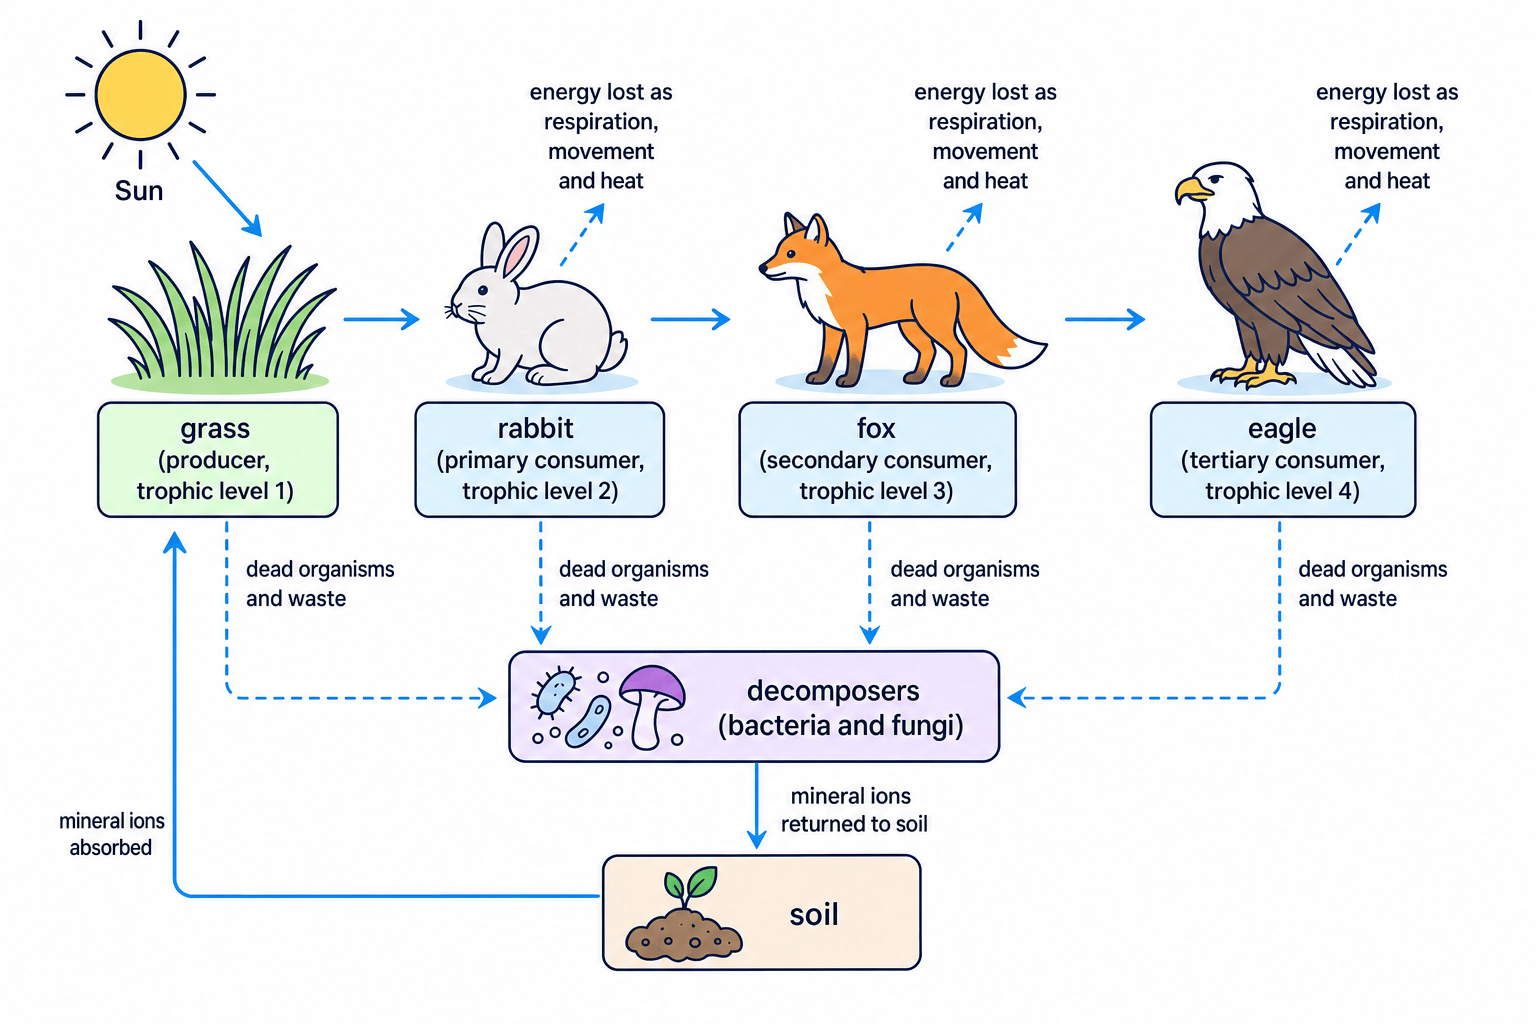
Trophic level pattern
The producer is trophic level 1. Each feeding step after that increases the trophic level by one. Decomposers act on dead material and waste from all trophic levels.
Identifying trophic levels
In the food chain clover → slug → blackbird → sparrowhawk:
- The clover is a green plant, so it is the producer and is at trophic level 1.
- The slug eats the producer, so the slug is the primary consumer at trophic level 2.
- The blackbird eats the slug, so the blackbird is the secondary consumer at trophic level 3.
- The sparrowhawk eats the blackbird, so the sparrowhawk is the tertiary consumer at trophic level 4.
Arrow direction
In food chains and food webs, arrows show the direction of energy transfer. The arrow points from the food to the feeder, for example grass → rabbit means energy passes from grass to rabbit.
Food chains and food webs
A food chain is a sequence showing feeding relationships between organisms. It is usually a simplified route of energy transfer.
For example:
grass → grasshopper → frog → snake
A food web is a network of interconnected food chains. Food webs are more realistic because most organisms eat more than one type of food and may be eaten by more than one predator.
Food webs also show that changes in one population can affect others. A population is all the organisms of one species living in a particular area.
Predicting changes in a food web
A food web contains these feeding relationships: grass is eaten by rabbits and mice; rabbits are eaten by foxes; mice are eaten by foxes and owls. Predict what may happen if the number of foxes decreases.
- Fewer foxes means less predation on rabbits and mice, so rabbit and mouse populations may increase.
- More rabbits would eat more grass, so the grass population may decrease.
- More mice could provide more food for owls, so the owl population may increase, as long as other factors such as disease or nesting sites do not limit them.
Use cautious prediction language
In food web questions, words like may increase or is likely to decrease are often safer than saying a change will definitely happen, because real ecosystems have many interacting factors.
Ecological pyramids
A pyramid is a diagram where each bar represents a trophic level. The width of each bar shows a quantity for that level.
There are three important types: pyramids of number, pyramids of biomass and pyramids of energy transfer.
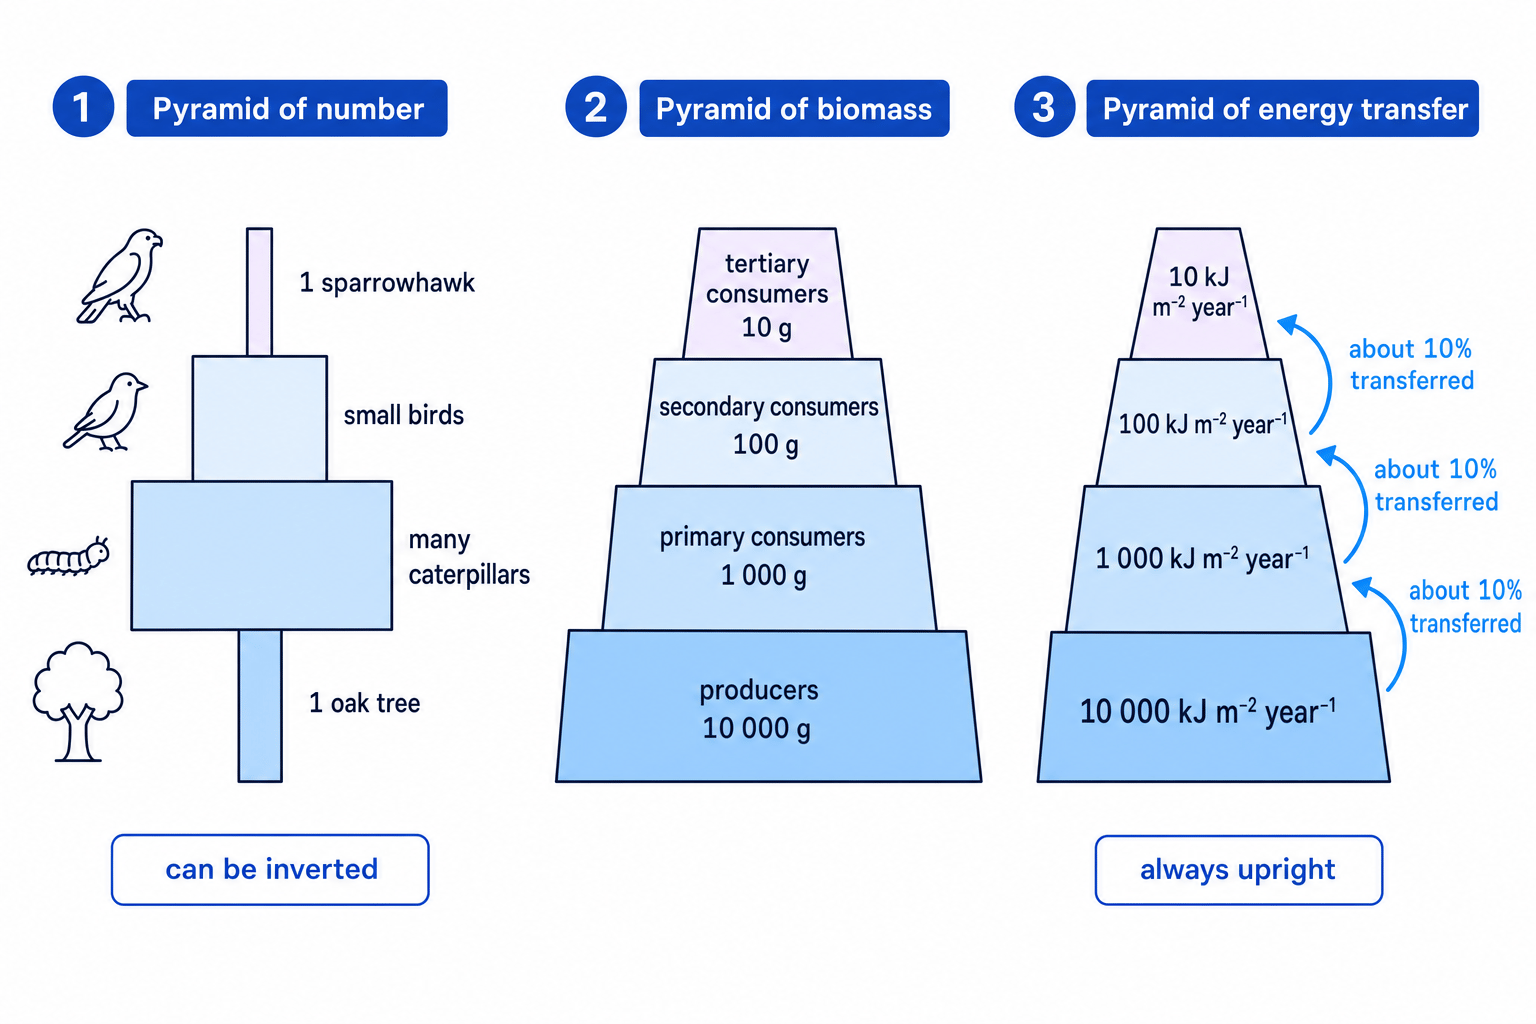
Pyramid of number
A pyramid of number shows the number of organisms at each trophic level.
It can be misleading because it counts individuals but does not show their size. One oak tree may support hundreds of caterpillars, so the producer level could be very narrow while the primary consumer level is wide.
Pyramid of biomass
Biomass is the mass of living material in an organism or group of organisms. A pyramid of biomass shows the total biomass at each trophic level.
Biomass is often measured as dry mass, which means the mass after water has been removed. This is more reliable than fresh mass because water content varies a lot.
Pyramids of biomass are usually pyramid-shaped because biomass is lost at each trophic level.
Pyramid of energy transfer
A pyramid of energy transfer shows the amount of energy transferred through each trophic level, usually per unit area per unit time, such as kJ m−2 year−1\text{kJ m}^{-2}\text{ year}^{-1}kJ m−2 year−1.
A pyramid of energy transfer is always upright because energy is lost at every stage in a food chain.
Number is not biomass
A large tree counts as one organism in a pyramid of number, but it has much more biomass than one caterpillar. Do not assume “more organisms” means “more biomass”.
Choosing a pyramid shape
A habitat contains 1 apple tree, 800 aphids, 40 ladybirds and 2 small birds.
- For a pyramid of number, compare the number of organisms at each trophic level: 1 producer, 800 primary consumers, 40 secondary consumers and 2 tertiary consumers.
- The producer bar would be very narrow because there is only one apple tree, while the aphid bar would be very wide.
- This pyramid of number would not look like a normal pyramid, but a pyramid of biomass would probably be more pyramid-shaped because the apple tree has a large total mass.
Transfer of substances and energy
When one organism eats another, substances such as carbohydrates, proteins, lipids and mineral ions are transferred along the food chain. Some of these substances are built into the consumer’s biomass.
Energy is also transferred, but not all of it becomes biomass in the next trophic level.
Respiration is the chemical process in cells that releases energy from glucose. Organisms use this energy for movement, growth, keeping warm, active transport and other life processes. Energy released during respiration is eventually transferred to the surroundings as heat.
Energy flows, substances cycle
Energy flows through an ecosystem and is eventually lost as heat. Substances can be recycled, especially when decomposers break down dead organisms and waste, returning mineral ions to the soil.
Why only about 10% of energy is transferred
Only about 10% of energy is usually transferred from one trophic level to the next. This is not an exact rule every time, but it is a useful estimate for IGCSE.
Energy transfer is inefficient because:
- Not all parts of an organism are eaten, such as bones, fur, roots or woody stems.
- Not all eaten food is digested and absorbed; some is egested, meaning passed out as faeces.
- Some absorbed substances are excreted, meaning removed as metabolic waste, such as urea.
- Much of the absorbed food is used in respiration, and energy is lost as heat.
- Some organisms die before being eaten, so their energy goes to decomposers instead.
The energy that is available to the next trophic level is mainly the energy stored in new biomass.
You may calculate percentage energy transfer using:
percentage transfer=energy in next trophic levelenergy in previous trophic level×100\begin{aligned} \text{percentage transfer} &= \frac{\text{energy in next trophic level}}{\text{energy in previous trophic level}} \times 100 \end{aligned}percentage transfer=energy in previous trophic levelenergy in next trophic level×100Calculating energy transfer
In a grassland, producers store 24 000 kJ m−2 year−1\text{kJ m}^{-2}\text{ year}^{-1}kJ m−2 year−1. Primary consumers store 2400 kJ m−2 year−1\text{kJ m}^{-2}\text{ year}^{-1}kJ m−2 year−1. Secondary consumers store 240 kJ m−2 year−1\text{kJ m}^{-2}\text{ year}^{-1}kJ m−2 year−1.
- Calculate the transfer from producers to primary consumers: 2 40024 000×100=10%\frac{2\,400}{24\,000} \times 100 = 10\%240002400×100=10%.
- Calculate the transfer from primary consumers to secondary consumers: 2402 400×100=10%\frac{240}{2\,400} \times 100 = 10\%2400240×100=10%.
- The results show that about 10% of the energy is transferred at each feeding step, so much less energy is available for higher trophic levels.
Why food chains are short
Because so much energy is lost at each trophic level, there is usually not enough energy to support many top predators. This is why food chains rarely have more than four or five trophic levels.
In the exam
- Read arrows as energy transfer from food to feeder.
- Use the correct trophic level names: producer, primary consumer, secondary consumer, tertiary consumer and decomposer.
- For pyramids, check whether the data are numbers, biomass or energy transfer before describing the shape.
- When explaining the 10% transfer, give specific losses such as respiration, heat loss, faeces, uneaten parts and dead material.
Check yourself
- In the chain grass → grasshopper → frog → snake, which organism is the secondary consumer?
- Why can a pyramid of number be inverted, but a pyramid of energy transfer cannot?
- Give three reasons why less energy reaches the next trophic level.
