

What you'll learn
- How to use the terms population, community, habitat and ecosystem correctly.
- How to estimate population size using quadrats in two different areas.
- What biodiversity means and how quadrats can be used to measure it (Paper 2 only).
- How abiotic and biotic factors affect where organisms live and how many survive.
Ecology starts with “where organisms live”
Ecology is the study of how organisms interact with each other and with their environment. In this topic, you are thinking like a field biologist: you collect data from real habitats, then use that data to describe patterns and suggest explanations.
A species is a group of organisms that can reproduce together to produce fertile offspring. For example, all common daisies belong to the same species.
Key ecology terms
- An organism is one individual living thing.
- A population is all the organisms of one species living in a particular area at the same time.
- A community is all the populations of different species living and interacting in an area.
- A habitat is the place where an organism lives.
- An ecosystem is a community of organisms interacting with each other and with the non-living parts of their environment.
Think of these terms as building up in scale: organism → population → community → ecosystem.
The nesting idea
A population is one species only. A community includes many species. An ecosystem includes the community plus non-living conditions such as light, temperature, water and soil.
Population is not the same as community
Do not write “the population of all animals in a pond”. That is a community, because it includes more than one species. A population would be “all the pond snails in the pond”.
Sampling organisms using quadrats
In ecology, it is usually impossible to count every individual organism in a habitat. Instead, scientists use sampling: collecting data from smaller parts of the habitat and using it to estimate the whole.
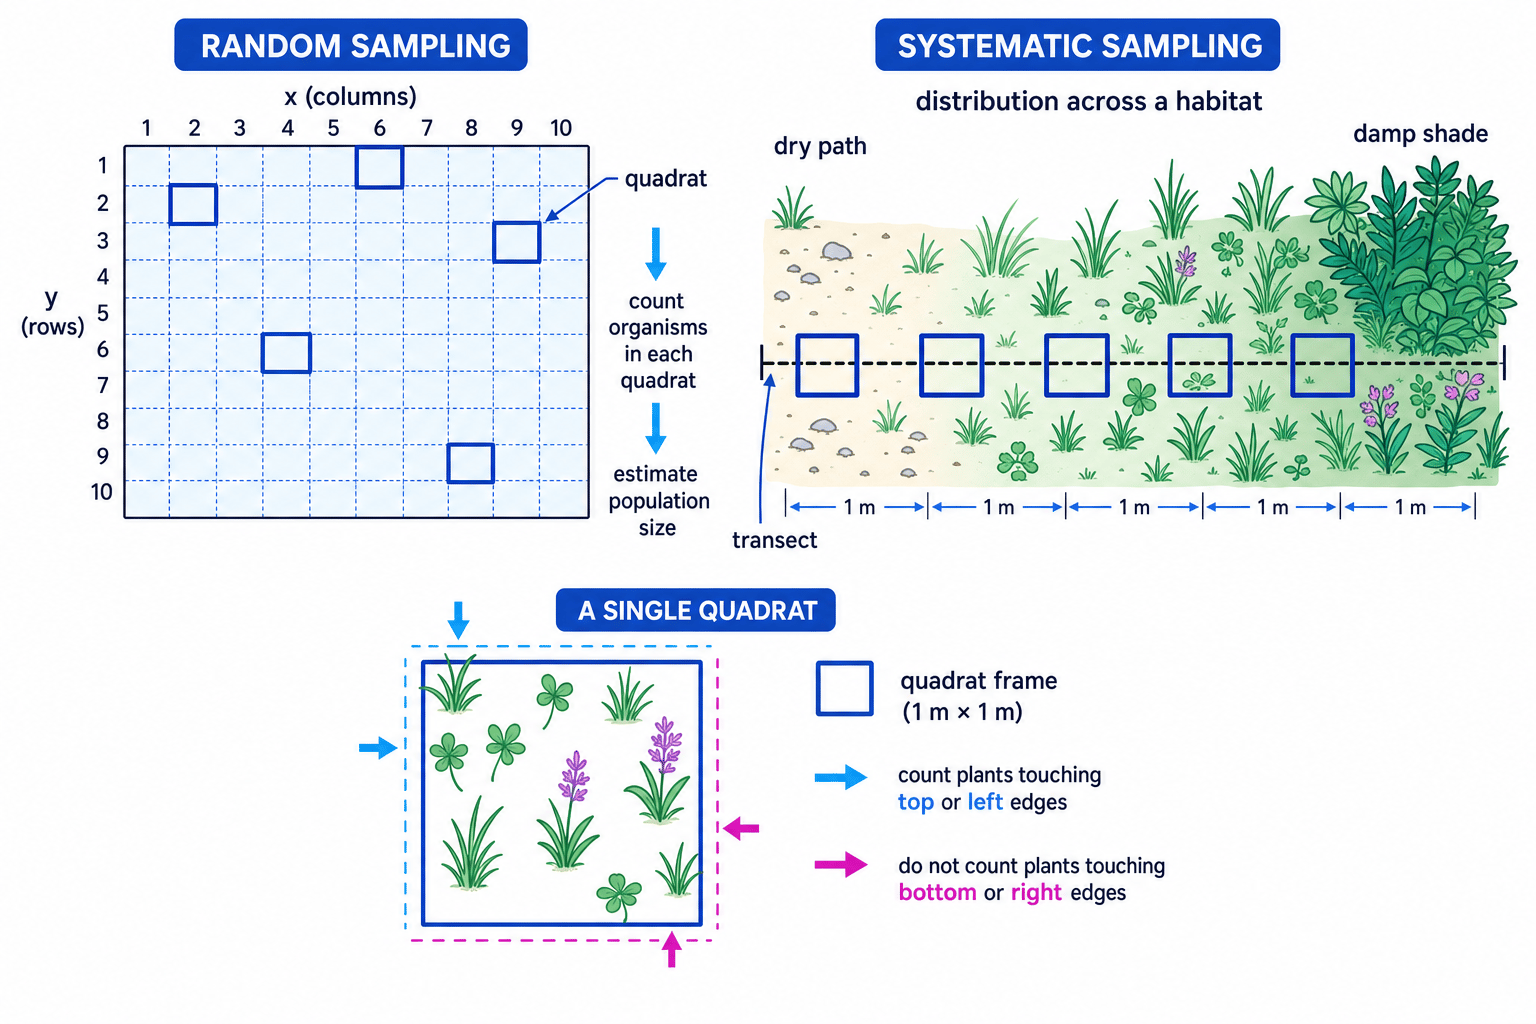
A quadrat is a square frame of known area, often 1 m by 1 m, placed on the ground to count organisms in that area. Quadrats are especially useful for plants or slow-moving animals.
The diagram shows two important sampling methods: random quadrats for estimating population size, and quadrats along a transect for investigating distribution.
Random sampling for population size
Random sampling means choosing quadrat positions without bias. This matters because you must not only sample the “interesting” or “easy” parts of the habitat.
A typical method is:
- Mark out the area using tape measures.
- Use random numbers to generate coordinates.
- Place the quadrat at each coordinate.
- Count the number of individuals of the target species in each quadrat.
- Repeat many times.
- Calculate a mean, then estimate the population size.
Population density means the number of individuals per unit area.
population density=number of individuals countedarea sampled\text{population density}=\frac{\text{number of individuals counted}}{\text{area sampled}}population density=area samplednumber of individuals countedThen:
estimated population size=population density×total habitat area\text{estimated population size}=\text{population density}\times \text{total habitat area}estimated population size=population density×total habitat areaEstimating population size with quadrats
A student samples a field with ten 1 m by 1 m quadrats. They count 8, 6, 5, 9, 7, 4, 6, 8, 7 and 5 daisies. The total field area is 200 m².
-
Find the total number of daisies counted:
8+6+5+9+7+4+6+8+7+5=658+6+5+9+7+4+6+8+7+5=658+6+5+9+7+4+6+8+7+5=65 daisies. -
Find the total area sampled. Each quadrat is 1 m² and there are ten quadrats:
10×1=1010\times 1=1010×1=10 m². -
Calculate the population density:
6510=6.5\frac{65}{10}=6.51065=6.5 daisies per m². -
Estimate the total population in the field:
6.5×200=13006.5\times 200=13006.5×200=1300 daisies.
Biased quadrat placement
If you place quadrats only where there are lots of organisms, your estimate will be too high. If you avoid dense patches, it will be too low. Use random coordinates to reduce bias.
Practical: comparing population size in two areas
For specification point 4.2, you need to understand how to investigate the population size of an organism in two different areas using quadrats.
For example, you might compare the number of daisies on a mown lawn and an unmown lawn.
Method
- Choose the organism you are counting and define the two areas clearly.
- Use the same size quadrat in both areas.
- Use random coordinates to place quadrats in the first area.
- Count the number of the organism in each quadrat.
- Repeat with the same number of quadrats in the second area.
- Calculate the mean number per quadrat, or calculate population density.
- Compare the two areas.
The independent variable is the area or habitat being compared. The dependent variable is the number of organisms per quadrat, population density or estimated population size. Control variables include quadrat size, number of quadrats, counting method, time of day or season, and the edge rule used.
The expected result is not one fixed answer. You are looking for a valid comparison: one area may have a higher population density because conditions are more suitable.
Counting edge organisms
Use a consistent rule, such as counting organisms touching the top and left edges, but not those touching the bottom and right edges. This avoids counting edge organisms twice.
Biodiversity
Biodiversity is a Paper 2 only idea in this section, but it is still worth learning carefully.
Biodiversity
Biodiversity is the variety of living organisms in an area. At IGCSE, you can compare it using the number of different species present and how abundant they are.
Two useful terms are:
- Species richness: the number of different species present.
- Abundance: how many individuals of each species are present.
A habitat with five species is usually more biodiverse than a habitat with only one species. However, biodiversity is also affected by whether one species completely dominates the area.
Comparing biodiversity from quadrat data
Two areas were sampled using the same number and size of quadrats.
| Species recorded | Area A total count | Area B total count |
|---|---|---|
| Grass species 1 | 48 | 20 |
| Daisy | 2 | 12 |
| Clover | 0 | 10 |
| Moss | 0 | 8 |
-
Compare species richness. Area A has two species recorded, while Area B has four species recorded.
-
Compare abundance pattern. Area A is dominated by grass species 1, with very few daisies. Area B has several species with more balanced counts.
-
Decide which area is more biodiverse. Area B is more biodiverse because it has greater species richness and is less dominated by one species.
Practical: distribution and biodiversity using quadrats
For specification point 4.4B, you need to understand how quadrats can be used to investigate the distribution of organisms in their habitats and measure biodiversity. This is Paper 2 only.
Distribution means where organisms are found within a habitat. Organisms are often not spread evenly. For example, moss may be common in damp shade but rare on a dry path.
A transect is a line placed across a habitat. In systematic sampling, quadrats are placed at regular intervals along this line, such as every 1 m. This is useful when there is an environmental gradient, such as from dry to wet, or from shaded to sunny.
Method for distribution
- Lay a tape measure across the habitat.
- Place a quadrat at regular intervals along the tape.
- Count the organisms, or estimate percentage cover if counting individuals is difficult.
- Record an abiotic factor at each point, such as light intensity or soil moisture.
- Look for a pattern between the organism’s abundance and the environmental conditions.
Percentage cover is an estimate of how much of the quadrat area is covered by a species. It is useful for grasses, mosses or spreading plants that are hard to count as separate individuals.
Percentage frequency is the percentage of quadrats in which a species is found.
percentage frequency=number of quadrats containing the speciestotal number of quadrats×100\text{percentage frequency}=\frac{\text{number of quadrats containing the species}}{\text{total number of quadrats}}\times 100percentage frequency=total number of quadratsnumber of quadrats containing the species×100Method for biodiversity
To measure biodiversity with quadrats:
- Place quadrats randomly, or systematically if you are investigating a gradient.
- Identify all the species in each quadrat.
- Count individuals or estimate percentage cover.
- Record species richness and abundance.
- Compare areas using the same sampling method.
Sources of error include misidentifying species, using too few quadrats, choosing quadrat positions non-randomly when random sampling is needed, and making subjective percentage cover estimates.
Abiotic and biotic factors
An abiotic factor is a non-living environmental factor. Examples include:
- light intensity
- temperature
- water availability or soil moisture
- soil pH
- mineral ion concentration
- oxygen or carbon dioxide concentration
- wind exposure
A biotic factor is a living factor or something caused by living organisms. Examples include:
- food availability
- competition
- predation
- disease
- grazing
- availability of mates
These factors affect both population size and distribution. A population increases when conditions allow more organisms to survive and reproduce. A population decreases when death rate is higher than birth rate, or when organisms move away.
Factors affect survival and reproduction
Abiotic and biotic factors change population size by affecting survival, reproduction and movement. They change distribution by making some parts of a habitat more suitable than others.
Interpreting a distribution pattern
A student places quadrats along a transect from a dry, sunny path into damp shade. Moss percentage cover increases from 5% near the path to 70% in the shaded area.
-
Compare the pattern in the data. Moss cover increases as the transect moves from dry, sunny conditions to damp, shaded conditions.
-
Link the pattern to abiotic factors. The damp shaded area has more water available and less drying out from direct sunlight.
-
Suggest a biological explanation. Moss is more successful where it does not lose water quickly, so its population is larger and its distribution is concentrated in damp shade.
Correlation is not proof
If two things change together, that is a correlation. It suggests a possible link, but you may need more evidence to show that one factor directly causes the change.
In the exam
- Use the correct scale term: population for one species, community for many species, and ecosystem for organisms plus abiotic conditions.
- For quadrat practicals, always mention random sampling, a large number of quadrats, the same quadrat size, and calculating a mean or density.
- When explaining distribution, link the pattern to a specific abiotic or biotic factor, then explain how it affects survival or reproduction.
Check yourself
- What is the difference between a population and a community?
- Why should quadrat positions be chosen randomly when estimating population size?
- How could light intensity or competition affect the distribution of plants in a habitat?
