Radioactive emissions

EasyMediumHard
1234567891011121314151617181920212223242526272829303132333435363738
Question 26
Medium
a.

A radioactive isotope has a half-life of 4 hours. Initially, a sample contains 160 g160\text{ g}160 g of this isotope. What mass of the isotope is left after 12 hours?

[2]
b.

The graph below shows the radiation activity emitted from samples of three different isotopes, X, Y, and Z, over a period of 10 days.
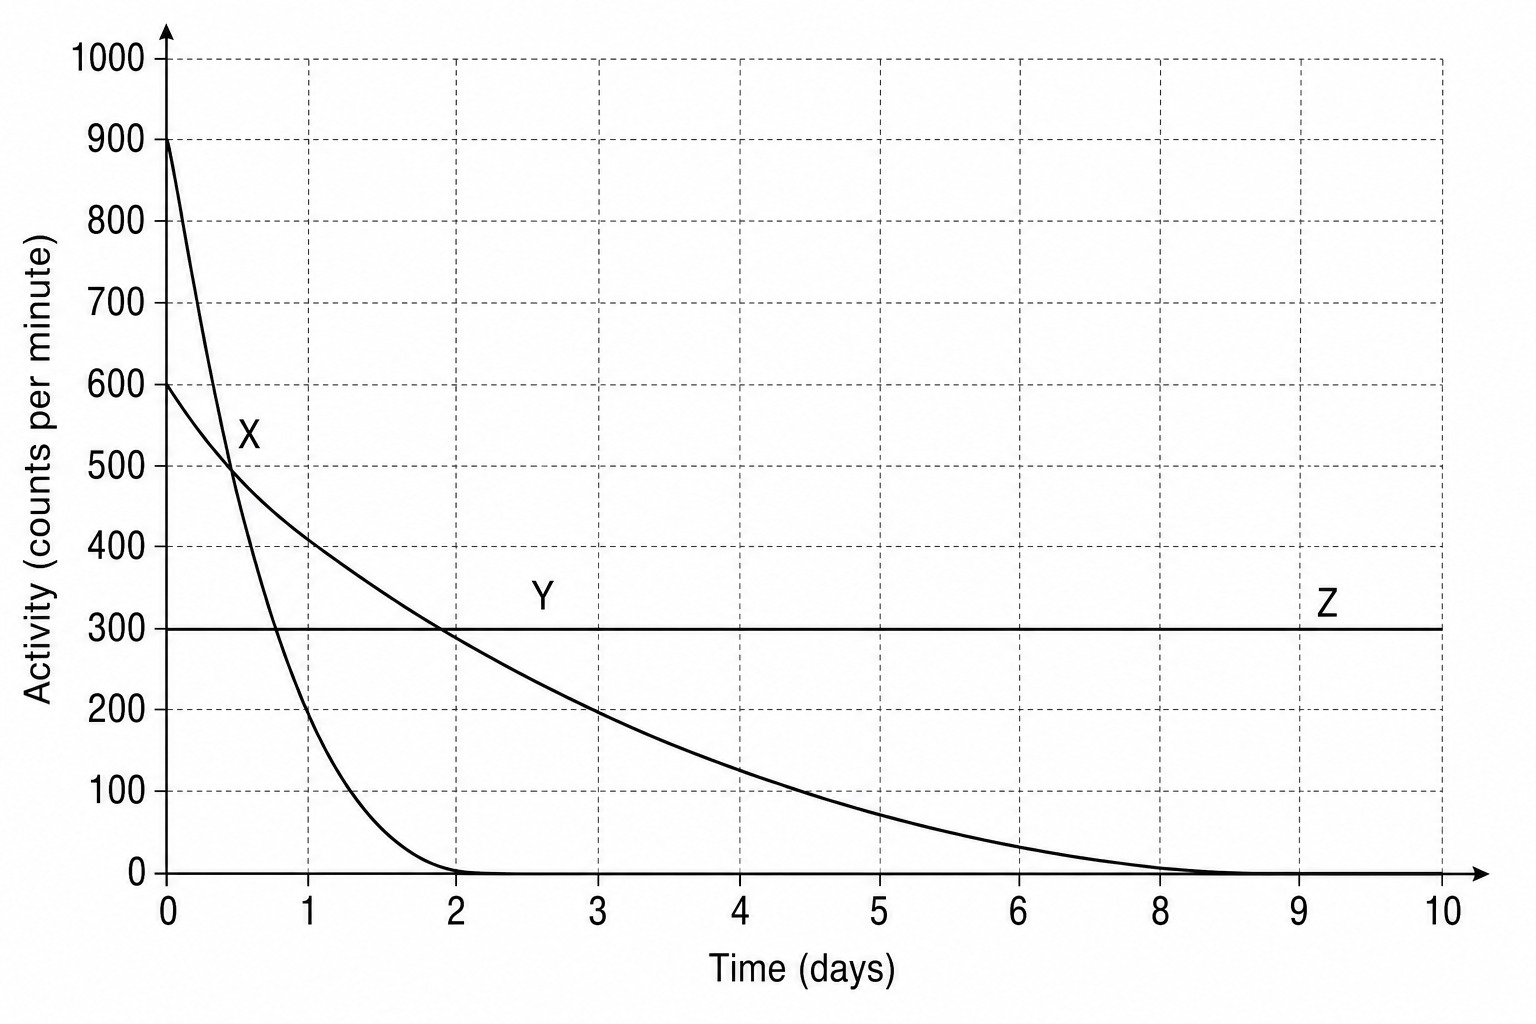
Graph of activity in counts per minute against time in days. The vertical axis shows Activity (counts per minute) from 0 to 1000. The horizontal axis shows Time (days) from 0 to 10. Curve X starts at an activity of 900 counts/min at day 0, and decreases very rapidly to nearly 0 by day 2. Curve Y starts at 600 counts/min on day 0, and decreases more gradually, reaching nearly 0 at day 8. Line Z is a horizontal line constant at 300 counts/min from day 0 to day 10.

Which isotope, X, Y, or Z, has the longest half-life?

[2]
c.

Explain why isotope X is initially more hazardous than isotope Y, but becomes less hazardous than isotope Y after 2 days.

[3]

Radioactive emissions Questions

  1. GCSE
  2. /Physics
  3. /Radioactive emissions