A student plots a graph of the recessional velocity of several distant galaxies against their distance from Earth to determine the Hubble constant (H0H_0H0). The table below shows the data collected:
| Distance from Earth (Mly) | Velocity of galaxy (km/s) |
|---|---|
| 60 | 1200 |
| 140 | 3100 |
| 210 | 4100 |
| 280 | 6600 |
| 350 | 7200 |
| 430 | 9800 |
| 510 | 10200 |
| 620 | 13900 |
| 700 | 14800 |
| 820 | 18500 |
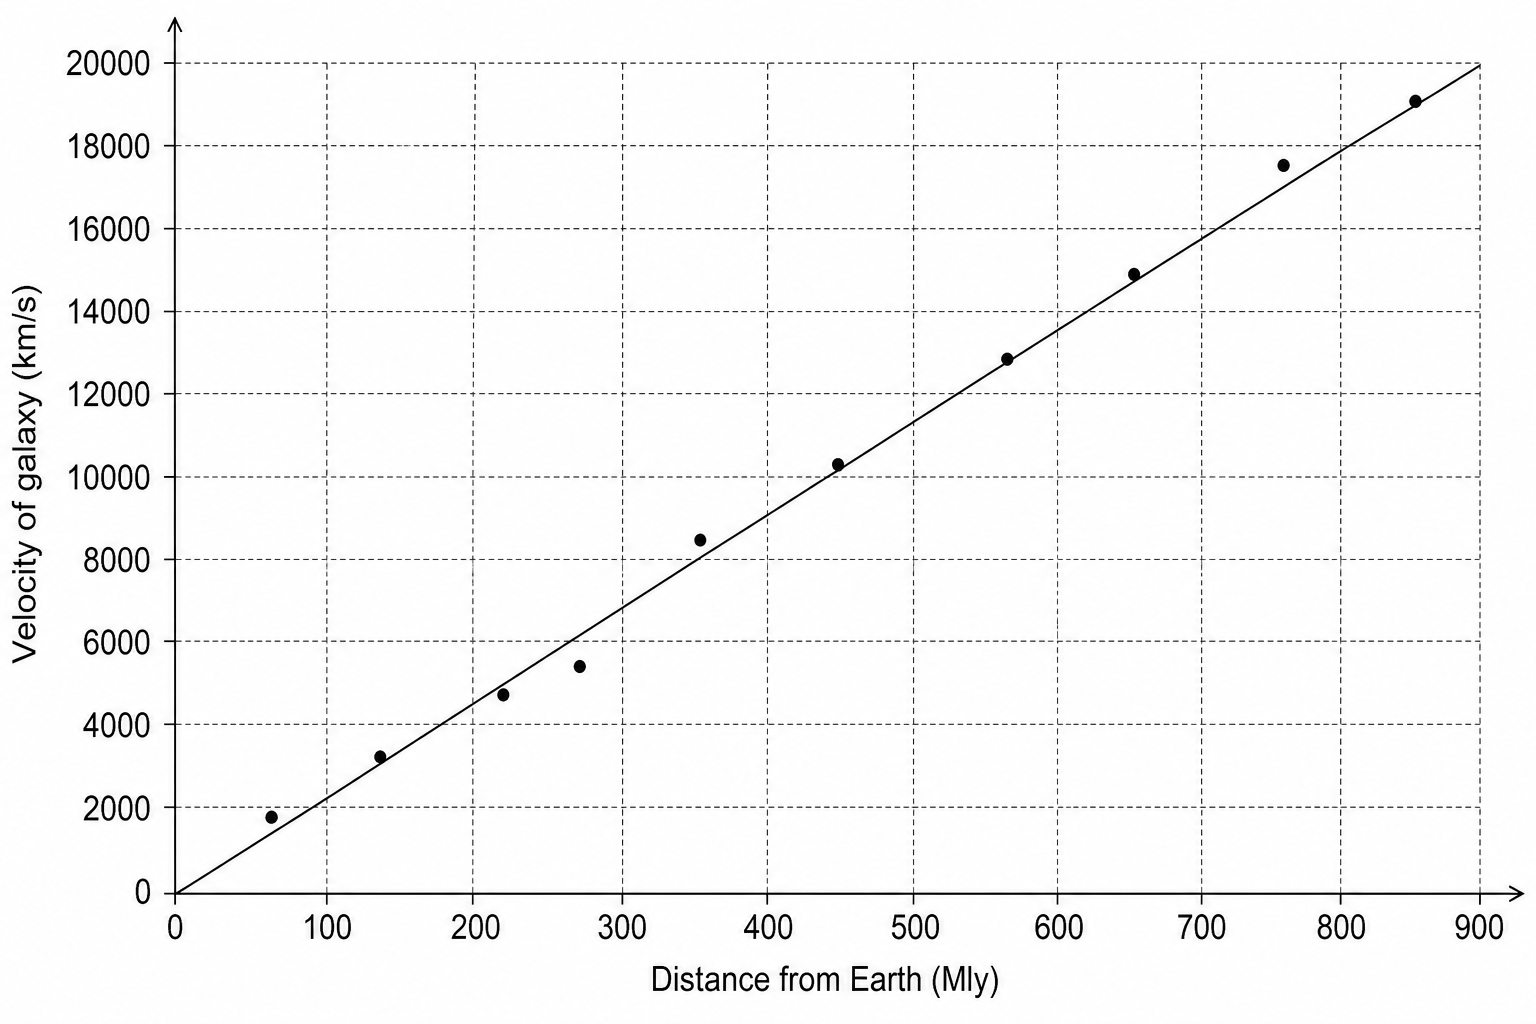
The gradient of this line of best fit can be used to calculate a value for the Hubble constant, which in turn is used to estimate the age of the Universe.
Explain why the gradient of this line can only provide an estimate of the age of the Universe.