The Big Bang, red-shift and the expanding Universe

EasyMediumHard
12345678910111213141516171819202122232425262728293031
Question 25
Medium

A group of astronomers measured the distances to several distant galaxies and their recessional velocities. Figure 1 shows the scatter plot with a line of best fit.
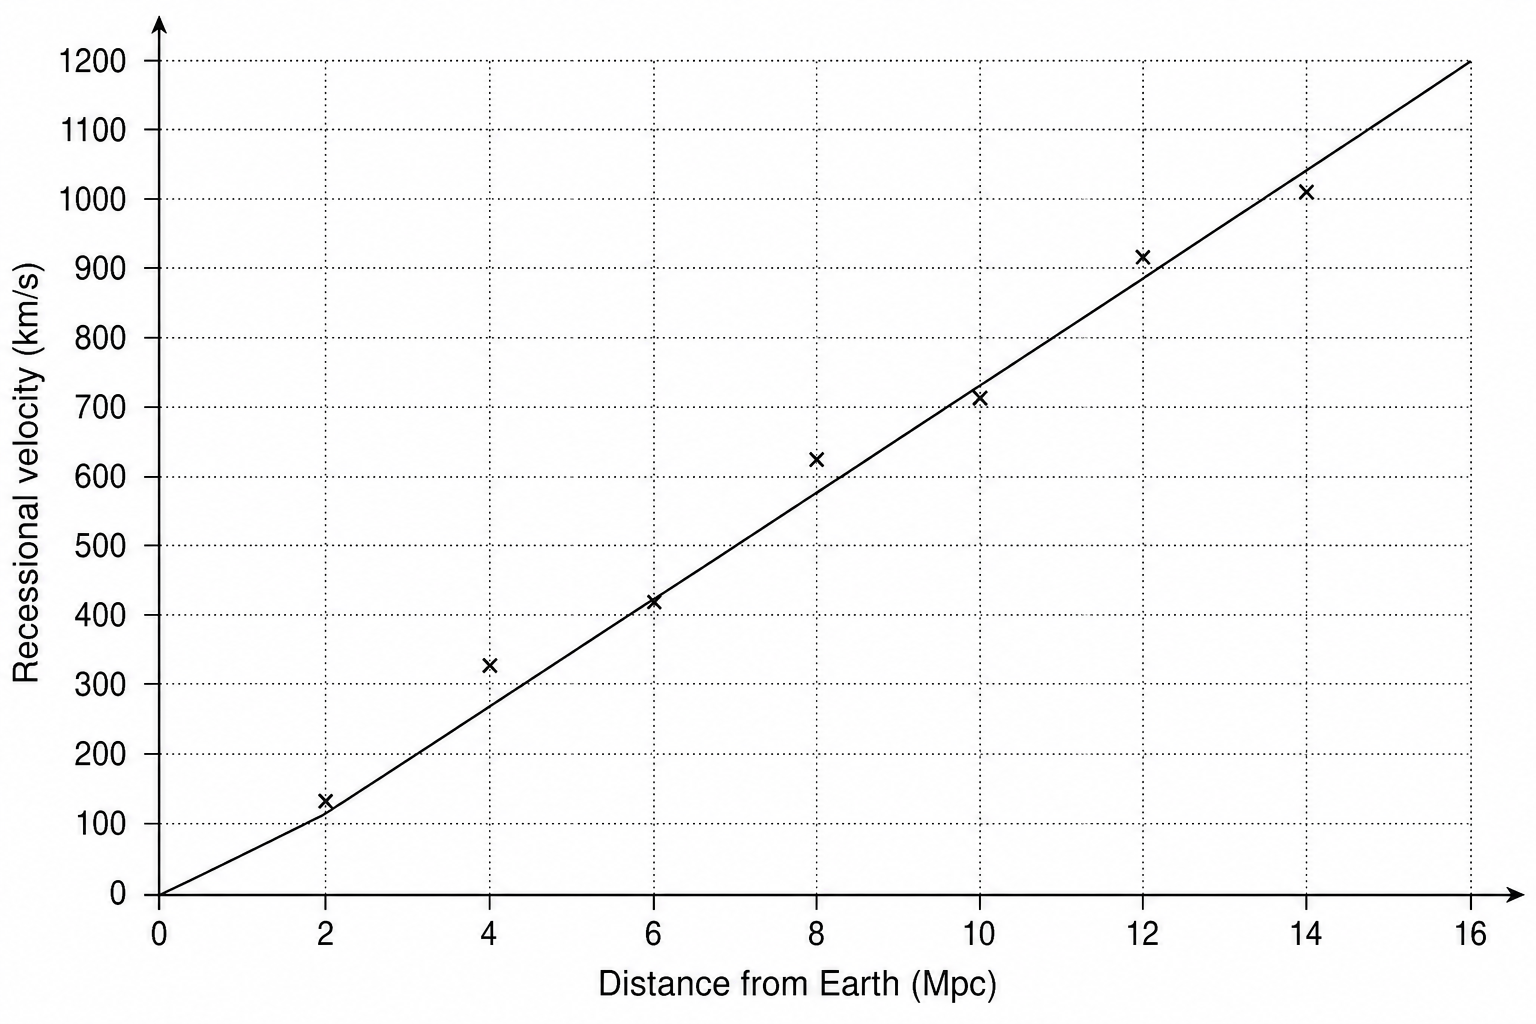
A scatter plot showing recessional velocity in km/s on the y-axis against distance from Earth in Mpc on the x-axis. The y-axis ranges from 0 to 1200 km/s. The x-axis ranges from 0 to 16 Mpc. A straight line of best fit is drawn, originating at (0, 0) and passing through the points (4.0, 300) and (12.0, 900).

Distance from Earth (Mpc)Recessional velocity (km/s)
2.0120
4.0320
6.0410
8.0620
10.0710
12.0920
14.01010

Calculate the gradient of the line of best fit shown in Figure 1.

State the unit.

[3]

The Big Bang, red-shift and the expanding Universe Questions

  1. GCSE
  2. /Physics
  3. /The Big Bang, red-shift and the expanding Universe