Question 2
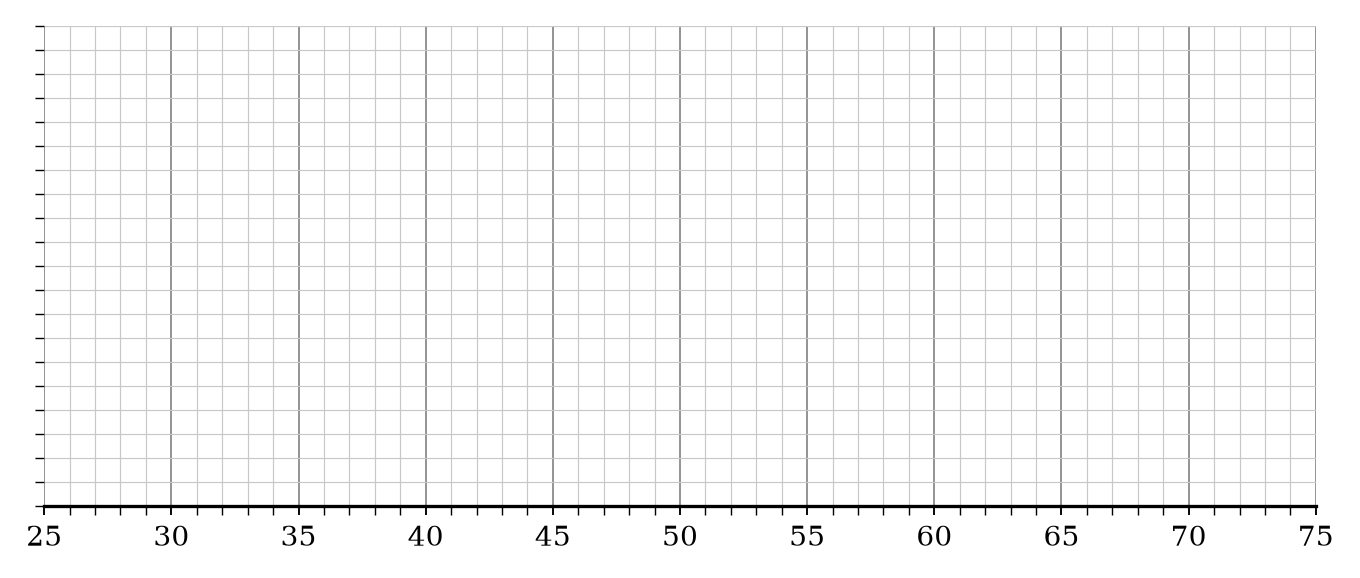
The table shows some information about the times, in minutes, it took several members of a running club to complete a 10 km run.
| Inter Quartile Range | Minimum | Median | Upper Quartile | Maximum |
|---|---|---|---|---|
| 10 | 35 | 50 | 55 | 70 |
a.[2]
Draw a box plot for this information.
b.[2]
A different group of runners also completed the 10 km run. The box plot below shows the distribution of their times.
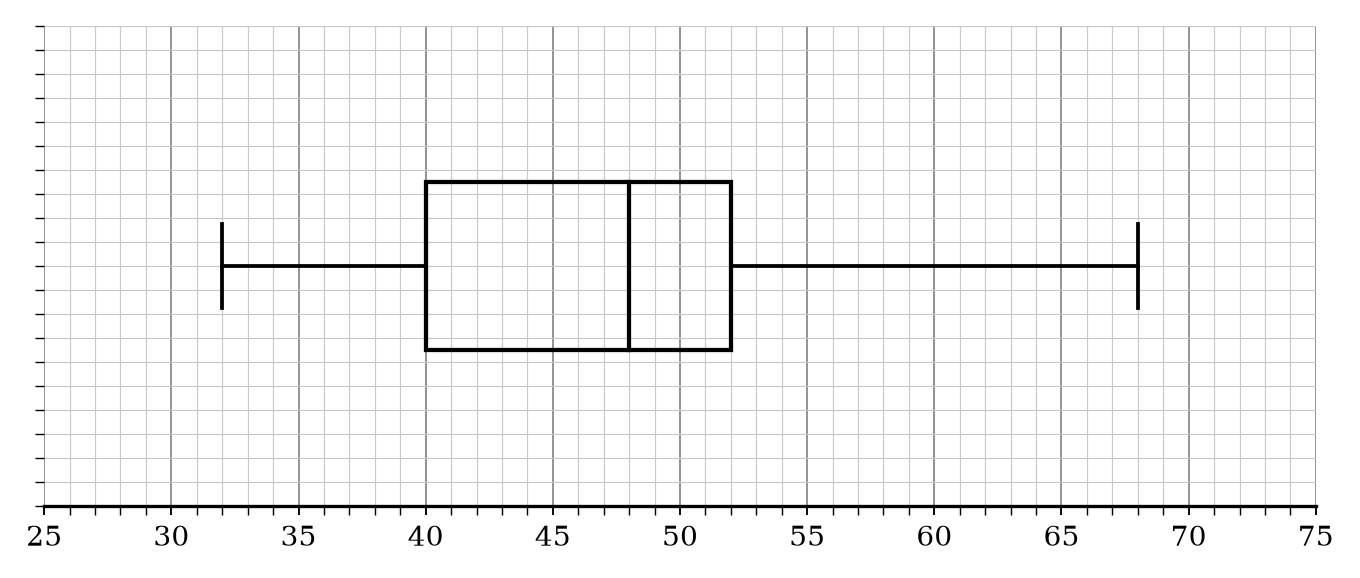
Compare the distribution of the times for the two groups of runners.
Box Plots Questions
27 exam-style questions on OCR GCSE Maths Box Plots. Each one has a worked solution and a mark scheme showing where the marks go.