Skip to content

Course home

Real Life and Distance Time Graphs

Real Life and Distance Time Graphs

MediumHard
12345678910
Question 7

A delivery van traveled from a warehouse to a city. The driver made one stop for a break.

Here is part of the van's travel graph.
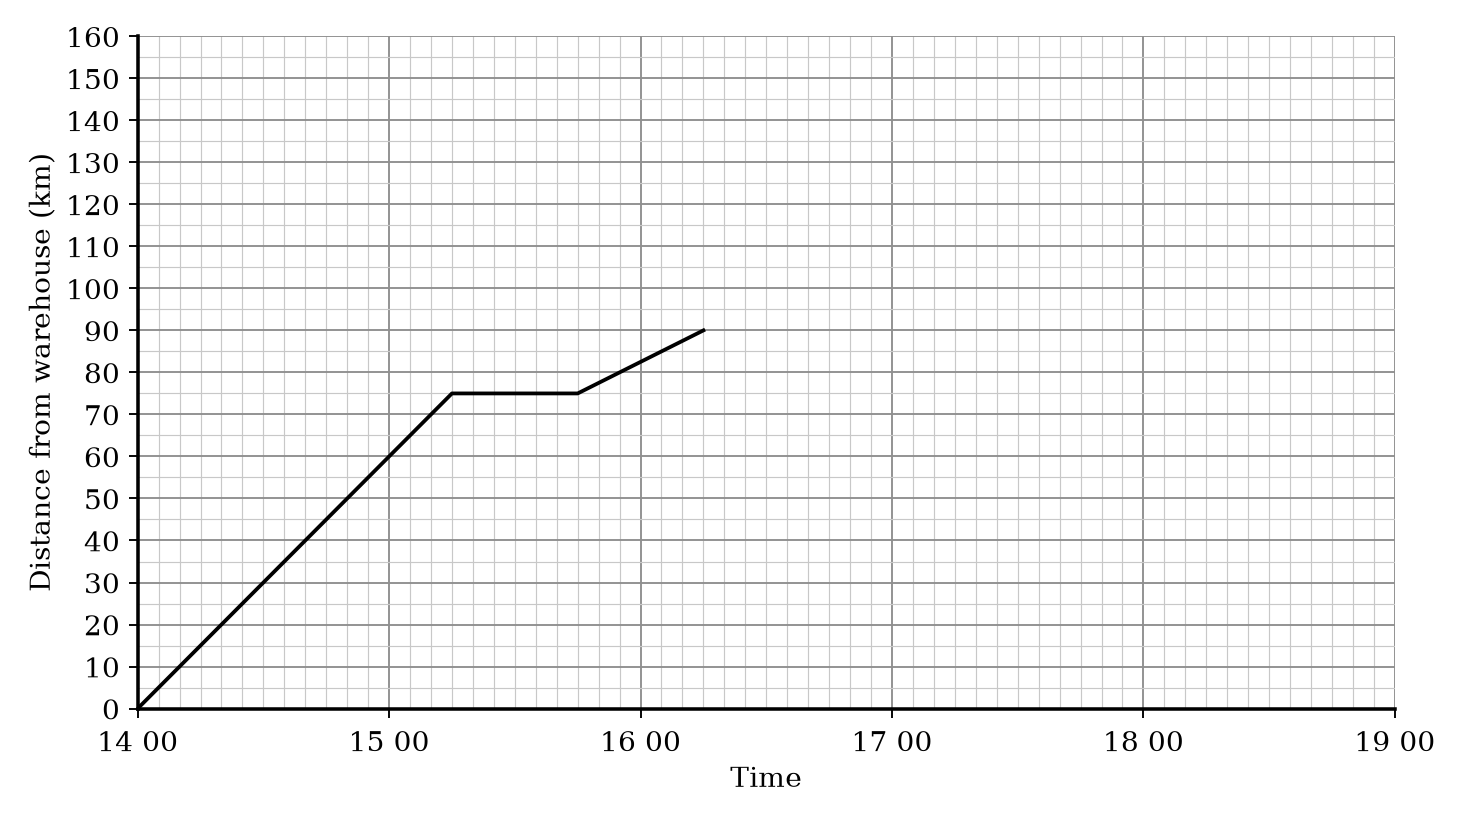
A travel graph showing distance from the warehouse in km against time. The y-axis ranges from 0 to 160 with major grid lines every 20 units and minor grid lines every 10 units. The x-axis shows times from 14 00 to 19 00 with major grid lines every hour and minor grid lines every 15 minutes. The graph consists of three straight line segments: from (14 00, 0) to (15 15, 75), from (15 15, 75) to (15 45, 75), and from (15 45, 75) to (16 15, 90).

A travel graph showing distance from the warehouse in km against time. The y-axis ranges from 0 to 160 with major grid lines every 20 units and minor grid lines every 10 units. The x-axis shows times from 14 00 to 19 00 with major grid lines every hour and minor grid lines every 15 minutes. The graph consists of three straight line segments: from (14 00, 0) to (15 15, 75), from (15 15, 75) to (15 45, 75), and from (15 45, 75) to (16 15, 90).

a.

For how many minutes did the driver stop for a break?

[1]
b.

What was the van's average speed between the warehouse and the break?

[2]
c.

The city is 150 km from the warehouse. The van arrived in the city at 18 00.

Complete the graph.

[2]
Markscheme

Real Life and Distance Time Graphs Questions

  1. GCSE
  2. /Maths
  3. /Real Life and Distance Time Graphs

17 exam-style questions on OCR GCSE Maths Real Life and Distance Time Graphs. Each one has a worked solution and a mark scheme showing where the marks go.

Question bank