Question 8
79%Bill is a taxi driver.
You can use this graph to find the cost of a taxi for different distances.
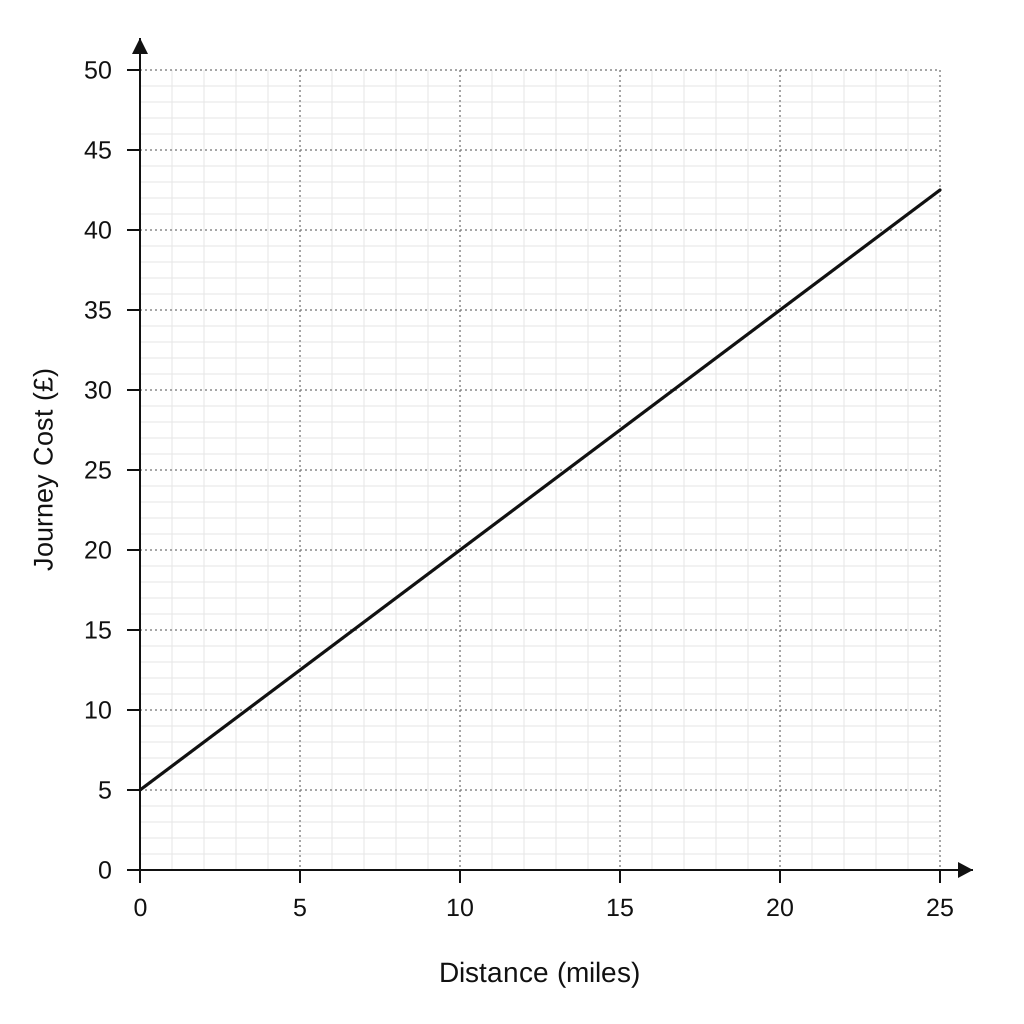
| Distance (miles) | Journey Cost (£) |
|---|---|
| 0 | 5 |
| 5 | 12.5 |
| 10 | 20 |
| 15 | 27.5 |
| 20 | 35 |
| 25 | 42.5 |
For each journey there is a fixed charge plus a charge for the distance.
a.[1]
How much is the fixed charge?
b.[2]
Bill makes two journeys.
The distance of one journey is 10 miles further than the other journey.
Work out the difference between the two journey costs.
Real Life and Distance Time Graphs Questions
17 exam-style questions on OCR GCSE Maths Real Life and Distance Time Graphs. Each one has a worked solution and a mark scheme showing where the marks go.