Question 1
70%Rebecca went on a bike ride. This graph shows Rebecca's distance from home on her bike ride.
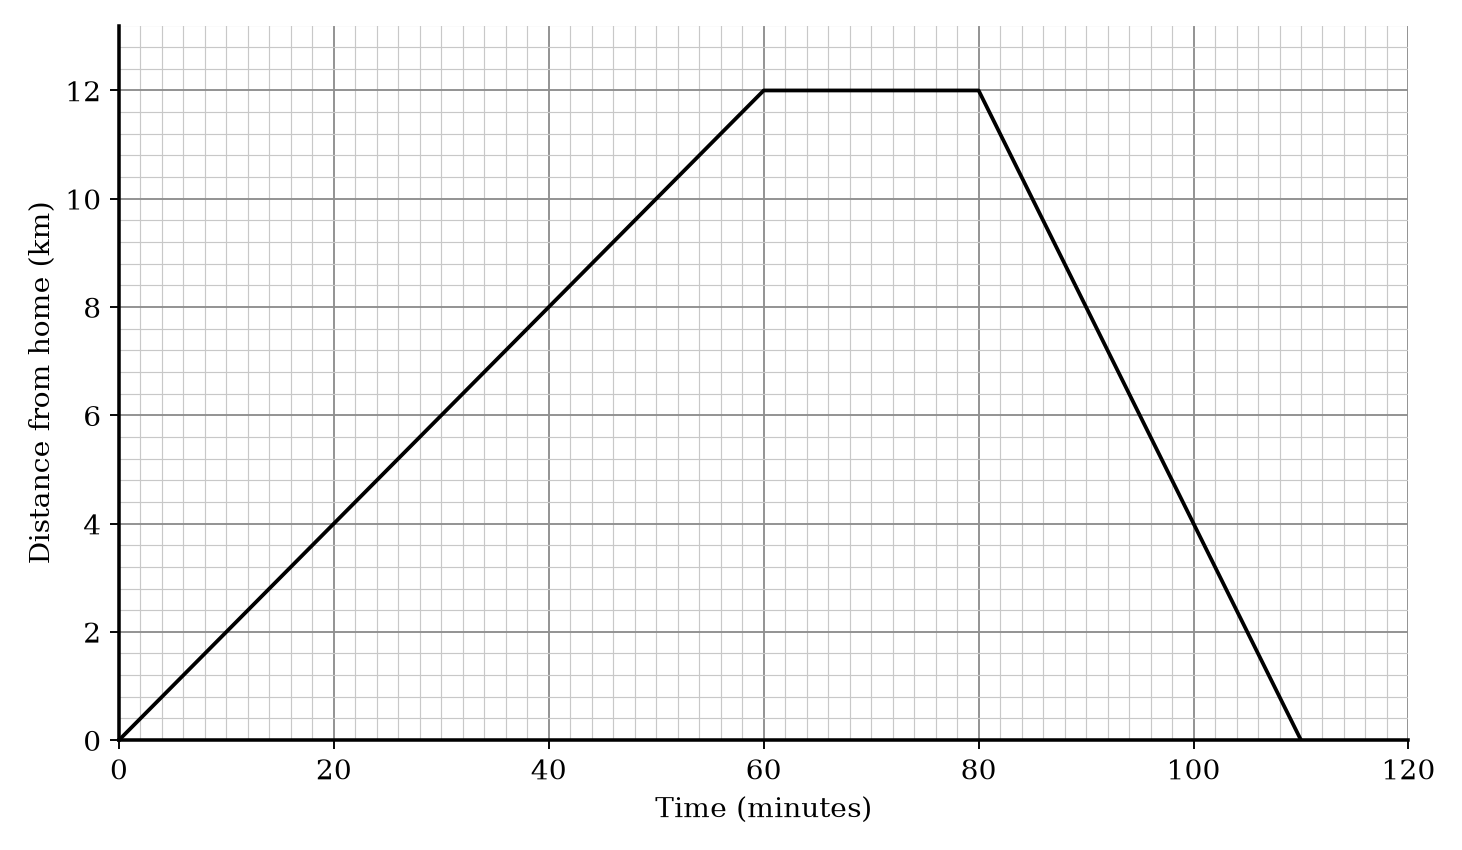
| Time (minutes) | Distance from home (km) |
|---|---|
| 0 | 0 |
| 30 | 6 |
| 60 | 12 |
| 80 | 12 |
| 110 | 0 |
a.[1]
How far had Rebecca travelled after 30 minutes?
b.[1]
After 60 minutes, Rebecca stopped for a rest. For how many minutes did she rest?
c.[1]
How far did Rebecca travel in total?
Real Life and Distance Time Graphs Questions
17 exam-style questions on OCR GCSE Maths Real Life and Distance Time Graphs. Each one has a worked solution and a mark scheme showing where the marks go.