Question 40
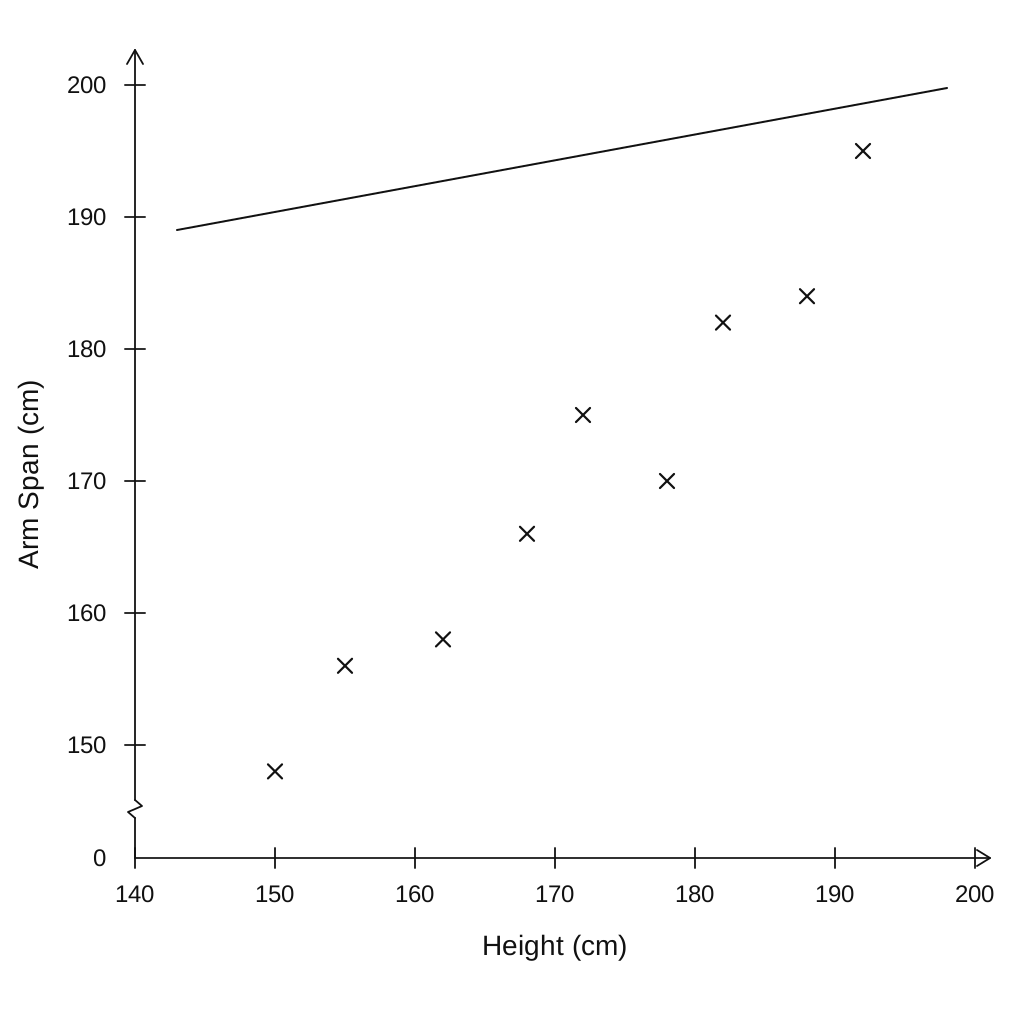
Maya measured the height and arm span of 9 different people. She was asked to display the data on a scatter graph. Here is her answer.
| Height (cm) | Arm Span (cm) |
|---|---|
| 150 | 148 |
| 155 | 156 |
| 162 | 158 |
| 168 | 166 |
| 172 | 175 |
| 178 | 170 |
| 182 | 182 |
| 188 | 184 |
| 192 | 195 |
Maya has plotted the points accurately.
Write down two things that are wrong with her answer.
Scatter Graphs Questions
54 exam-style questions on OCR GCSE Maths Scatter Graphs. Each one has a worked solution and a mark scheme showing where the marks go.