Question 33
The scatter graph shows information about the age and the height of a specific species of tree.
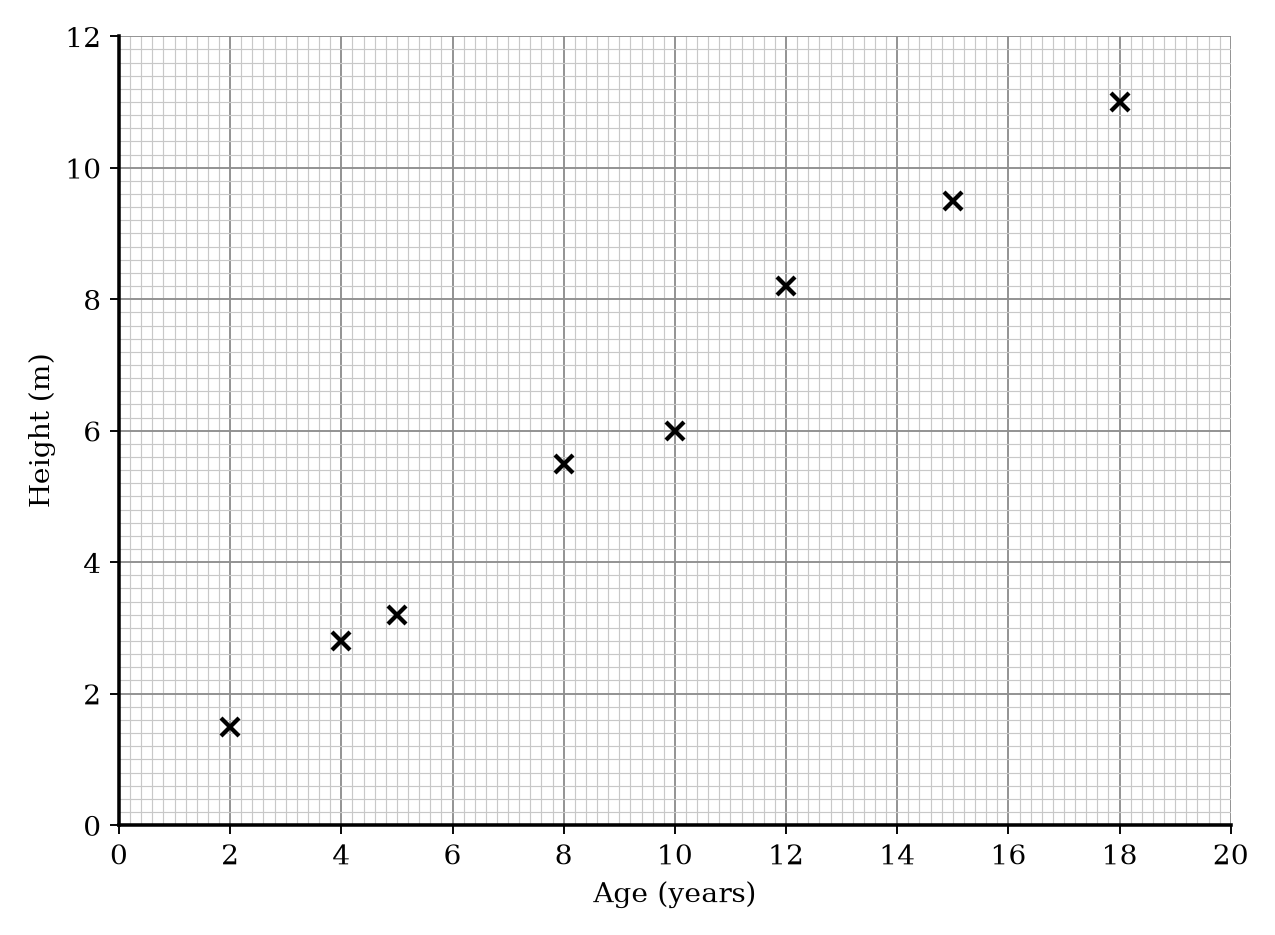
| Age (years) | Height (m) |
|---|---|
| 2 | 1.5 |
| 4 | 2.8 |
| 5 | 3.2 |
| 8 | 5.5 |
| 10 | 6.0 |
| 12 | 8.2 |
| 15 | 9.5 |
| 18 | 11.0 |
The table shows the age and height of two more trees.
| Age (years) | 7 | 14 |
| Height (m) | 4.8 | 9.0 |
a.[1]
Show this information on the scatter graph.
b.[2]
A tree of the same species has a height of 7.0 m. Use the scatter graph to estimate the age of this tree.
Scatter Graphs Questions
52 exam-style questions on OCR GCSE Maths Scatter Graphs. Each one has a worked solution and a mark scheme showing where the marks go.