Stage 4 Test B
Question 1
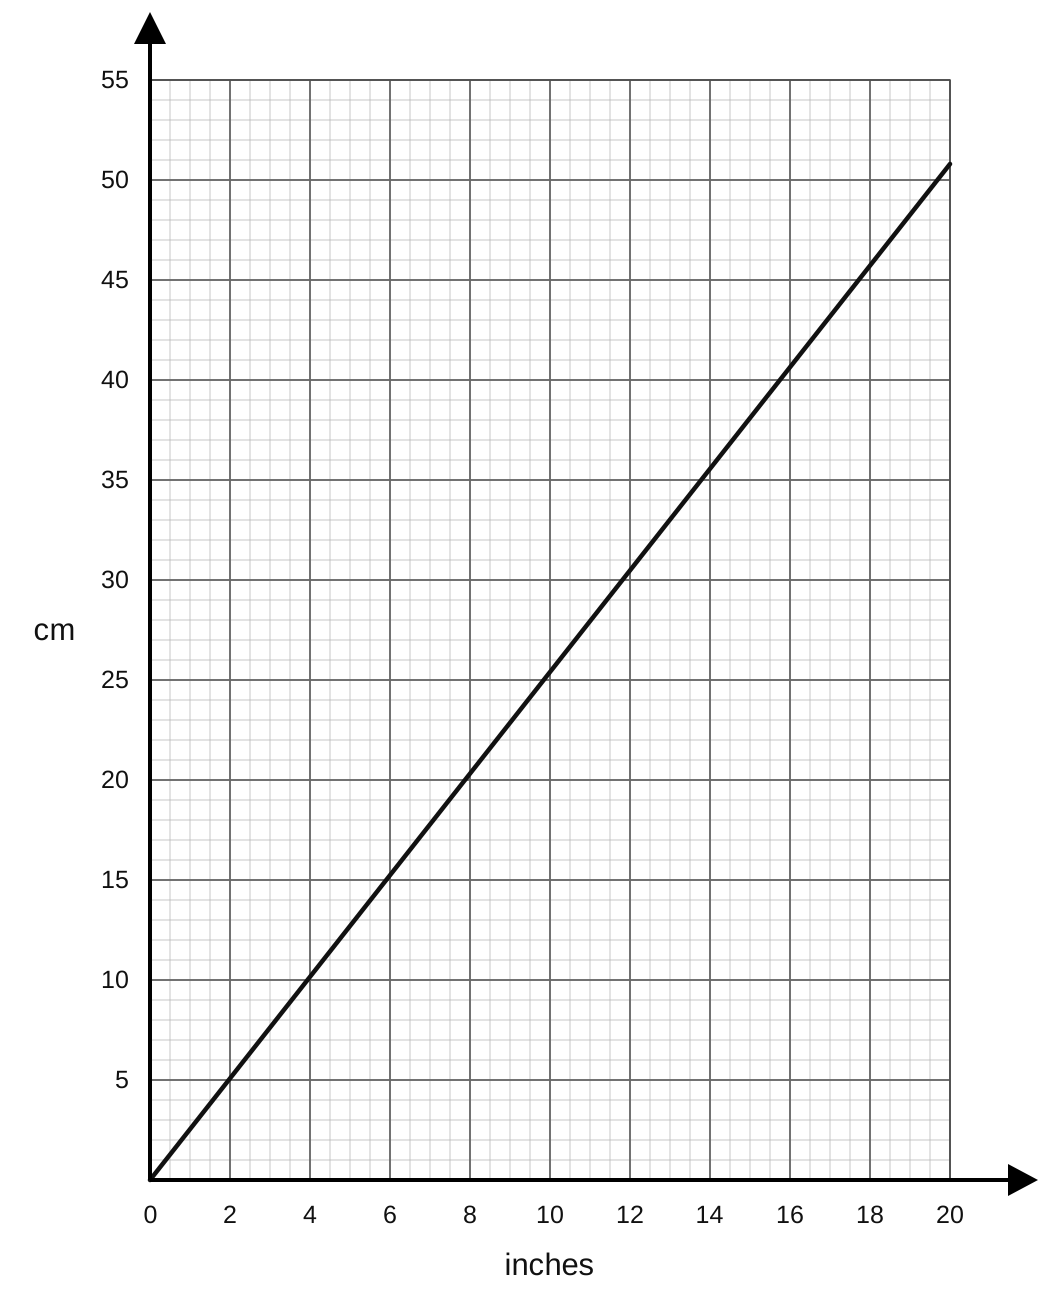
You can use this graph to change between inches and centimetres.
| inches | cm |
|---|---|
| 0 | 0 |
| 1 | 2.54 |
| 2 | 5.08 |
| 3 | 7.62 |
| 4 | 10.16 |
| 5 | 12.70 |
| 6 | 15.24 |
| 7 | 17.78 |
| 8 | 20.32 |
| 9 | 22.86 |
| 10 | 25.4 |
a.[1]
Change 5 inches to cm.
b.[2]
Change 45 cm to inches
Question 2
Here is a number machine.

graph LR; input --> box1[× 3]; box1 --> box2[+ 11]; box2 --> output
a.[1]
Find the output when the input is 5
b.[1]
Find the output when the input is -2
c.[2]
Find the input when the output is 32
Question 3
A model plane has the length of 20cm.
The scale of the model is 1:360
Work out the length of the real plane.
Give your answer in metres.
Question 4
Work out 184% of 140.
Question 5
There are only blue counters, red counters and yellow counters in a bag.
There are twice as many blue counters as yellow counters.
There are three times as many red counters as yellow counters.
Write down the ratio of blue counters to red counters to yellow counters.
Question 6
a.[2]
Work out 23−14\displaystyle \frac{2}{3} - \frac{1}{4}32−41
b.[2]
Work out 34×49\displaystyle \frac{3}{4} \times \frac{4}{9}43×94
Give your answer as a fraction in its simplest form.
Question 7
Work out the difference between 25\displaystyle \frac{2}{5}52 of 45 and 37\displaystyle \frac{3}{7}73 of 35
Question 8
The frequency table shows the time taken for 100 people to travel to an event.
| Time (minutes) | Frequency |
|---|---|
| 0<t≤100 < t \leq 100<t≤10 | 8 |
| 10<t≤2010 < t \leq 2010<t≤20 | 19 |
| 20<t≤3020 < t \leq 3020<t≤30 | 27 |
| 30<t≤4030 < t \leq 4030<t≤40 | 23 |
| 40<t≤5040 < t \leq 5040<t≤50 | 11 |
| 50<t≤6050 < t \leq 6050<t≤60 | 14 |
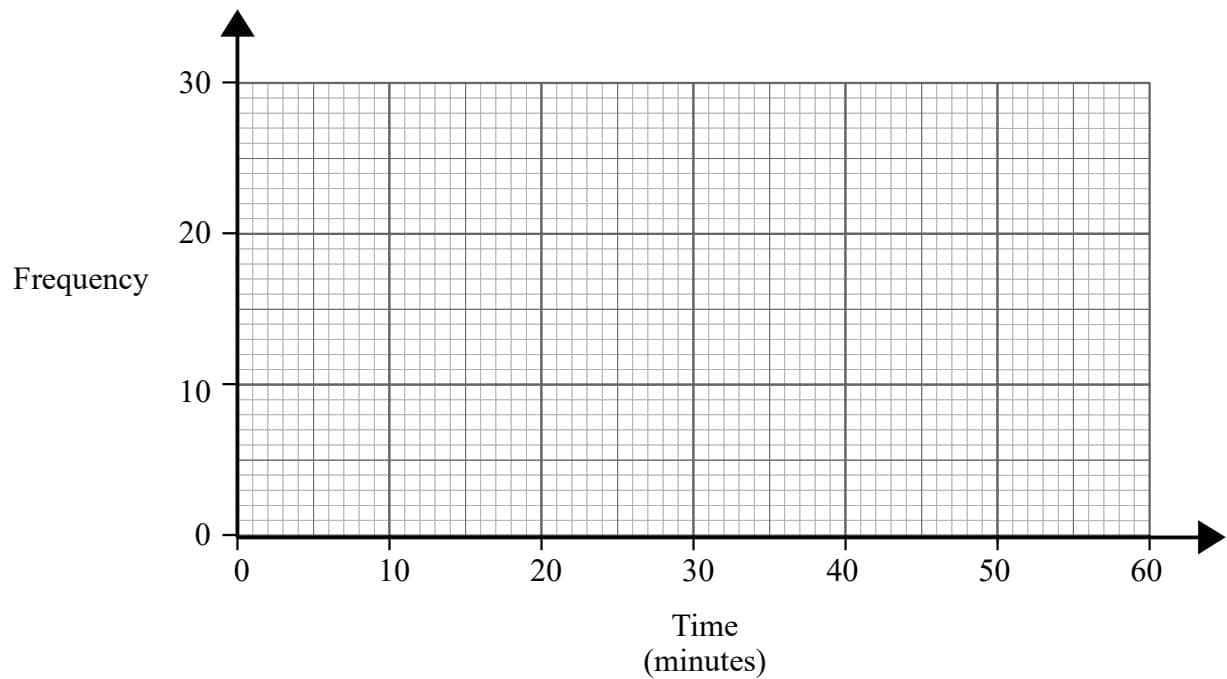
Draw a frequency polygon to show this information.
Question 9
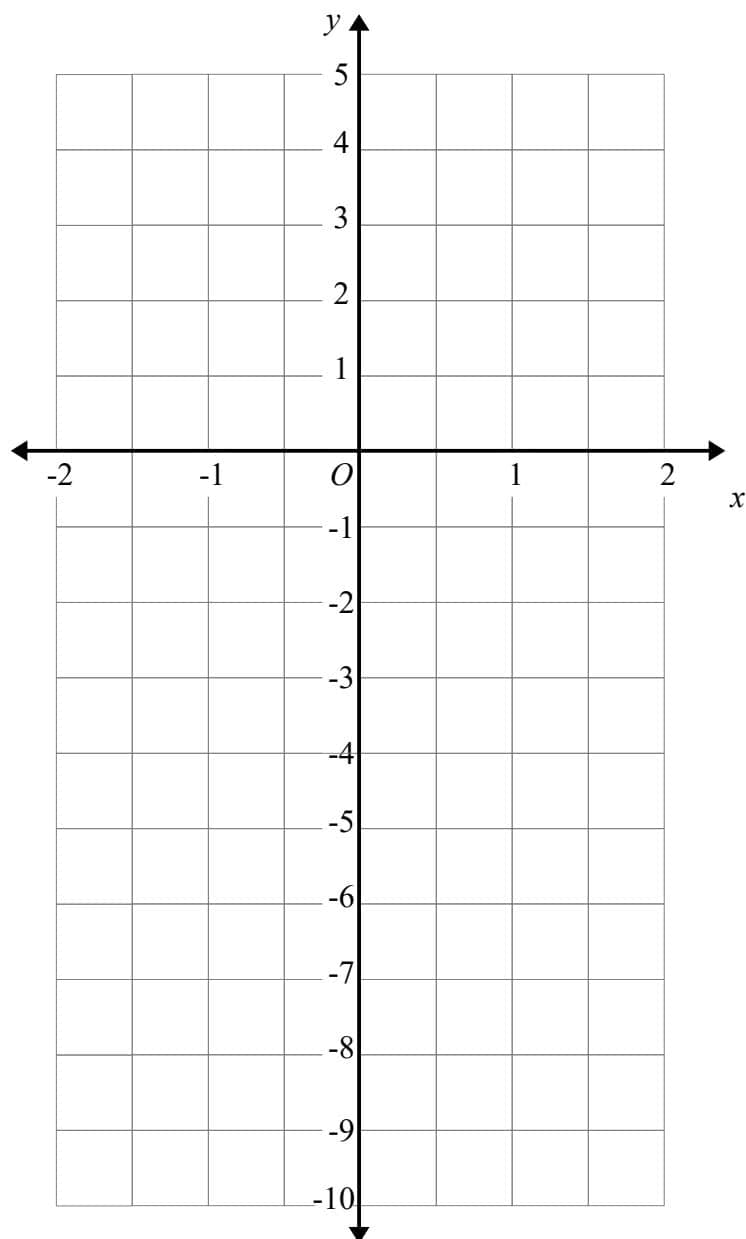
On the grid, draw the graph of y=3x−3y = 3x - 3y=3x−3 for values of x x\,x from -2 to 2