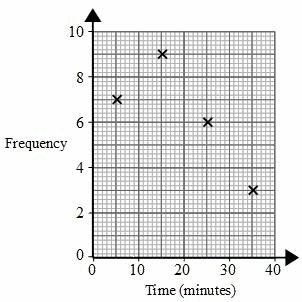
A frequency polygon is used to display grouped data
To draw a frequency polygon we plot the midpoint of the group against the frequency and then join the points with straight lines
Here is a frequency table showing the time, in minutes, it took for 25 students to get to school one day
| Time | Frequency | |
|
| | 0 ≤ t ≤ 10 | 7 | | 10 ≤ t ≤ 20 | 9 | | 20 ≤ t ≤ 30 | 6 | | 30 ≤ t ≤ 40 | 3 |
To draw a frequency polygon we plot the midpoint with each group against the frequency
The midpoint of 0 and 10 is 5
We could work this out by adding 0 and 10, and then dividing by 2: 0 + 10⁄2 = 5
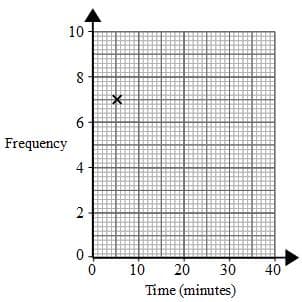
For the first point we plot (5, 7)
The midpoint of 10 and 20 is 15
10 + 20⁄2 = 15
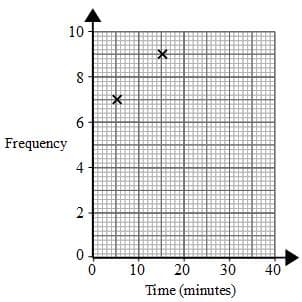
The second point is (15,9)
The midpoint of 20 and 30 is 25
20 + 30⁄2 = 25
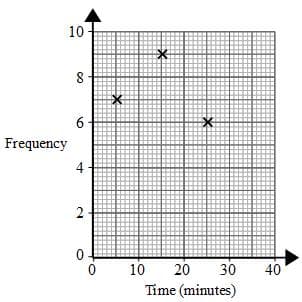
The next point is (25,6)
The midpoint of 30 and 40 is 35
30 + 40⁄2 = 35
The next point is (35,3)
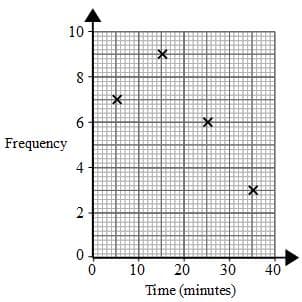
And finally we join the points with straight lines