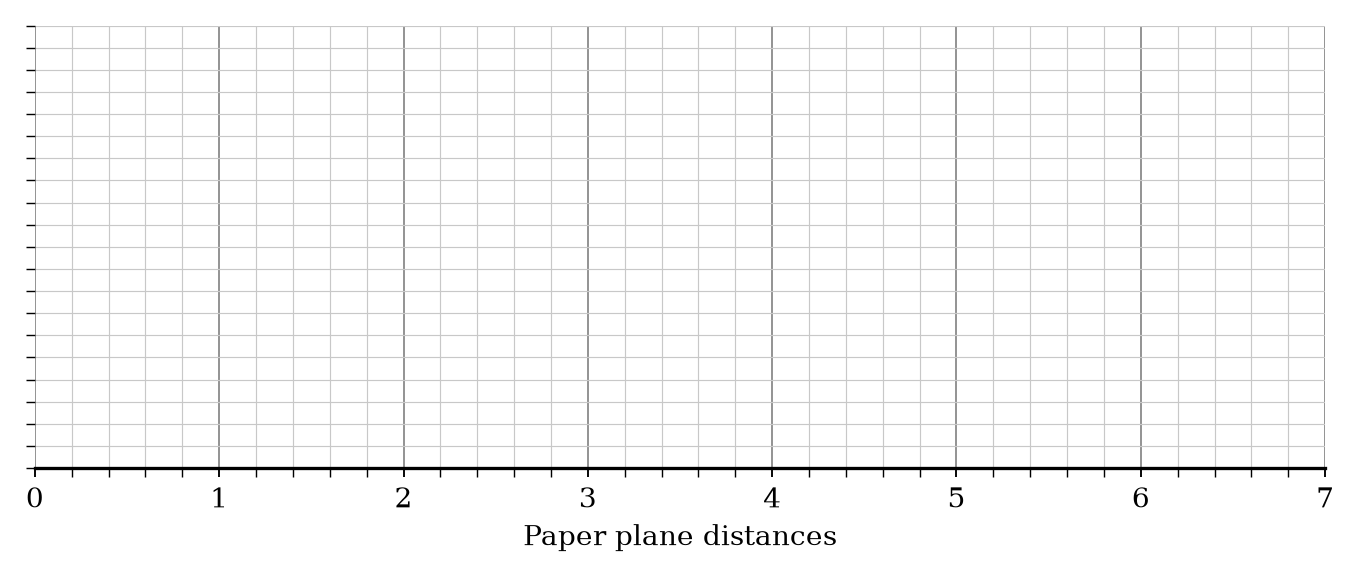
The table shows some information about the distances, in meters, that paper planes thrown by Group X travelled.
| Minimum | Lower Quartile | Median | Upper Quartile | Maximum |
|---|---|---|---|---|
| 1.2 | 2.4 | 3.1 | 4.0 | 5.8 |
Draw a box plot for this information.
The box plot below shows the distribution of the distances that paper planes thrown by Group Y travelled.
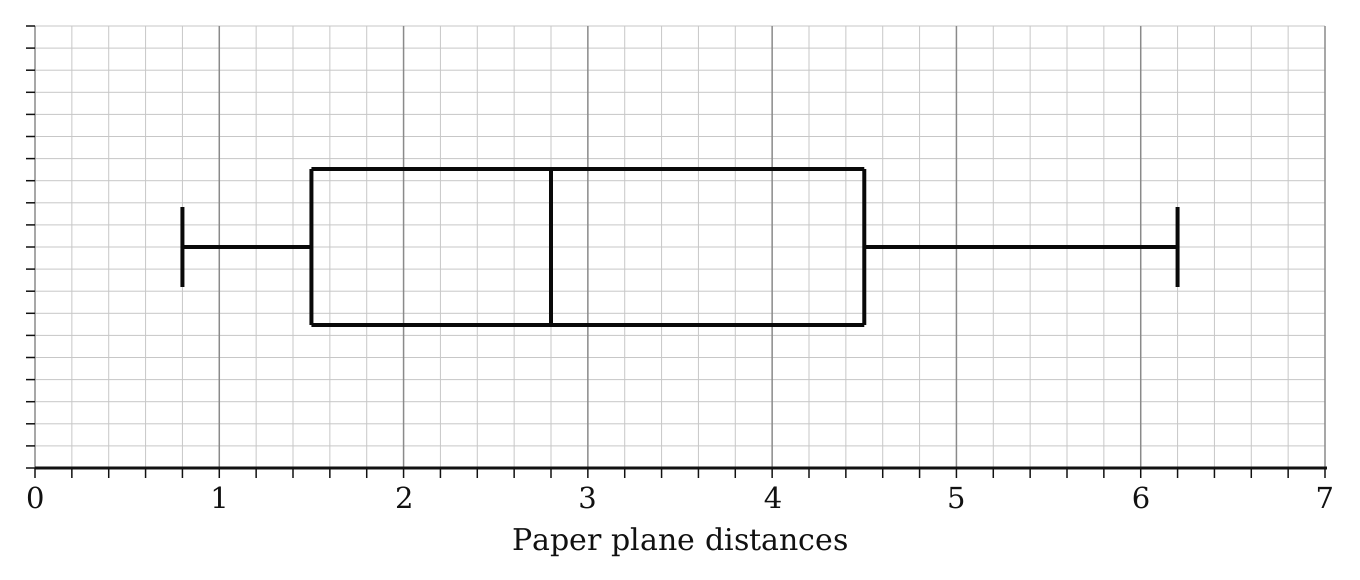
Compare the distribution of the distances for Group X with the distribution of the distances for Group Y.
27 exam-style questions on Edexcel GCSE Maths Box Plots. Each one has a worked solution and a mark scheme showing where the marks go.

