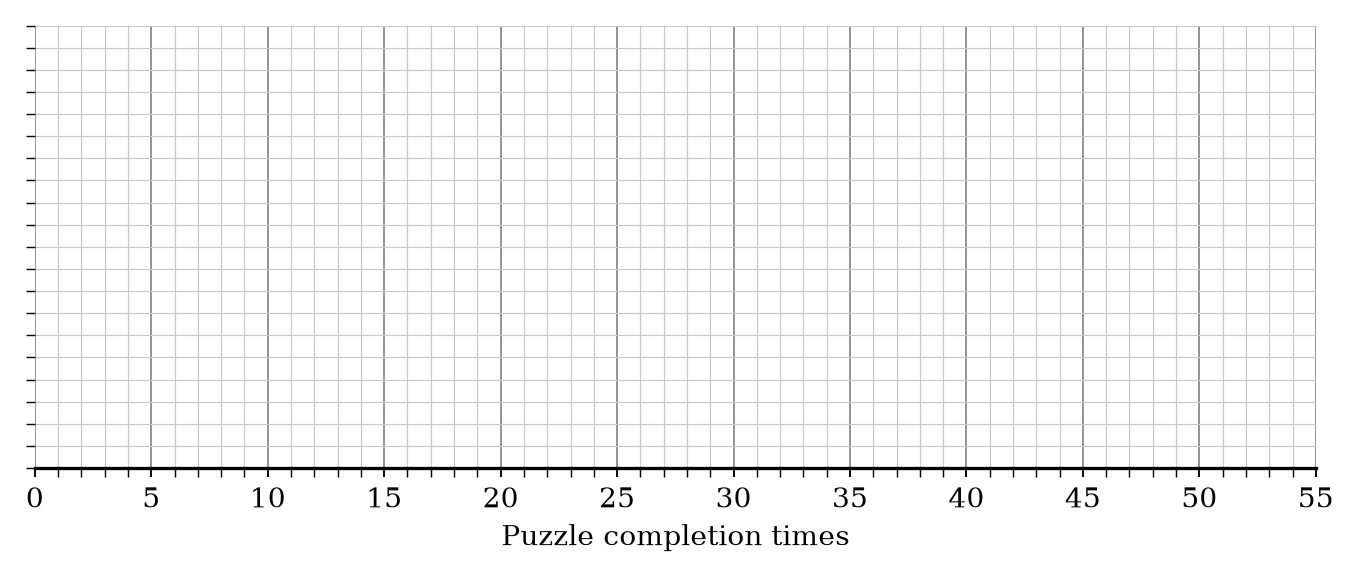
The table shows some information about the time, in minutes, taken by students in Class A to complete a puzzle.
| Minimum | Lower Quartile | Median | Upper Quartile | Maximum |
|---|---|---|---|---|
| 10 | 18 | 24 | 30 | 45 |
Draw a box plot for this information.
The box plot below shows the distribution of the times taken by students in Class B to complete the same puzzle.
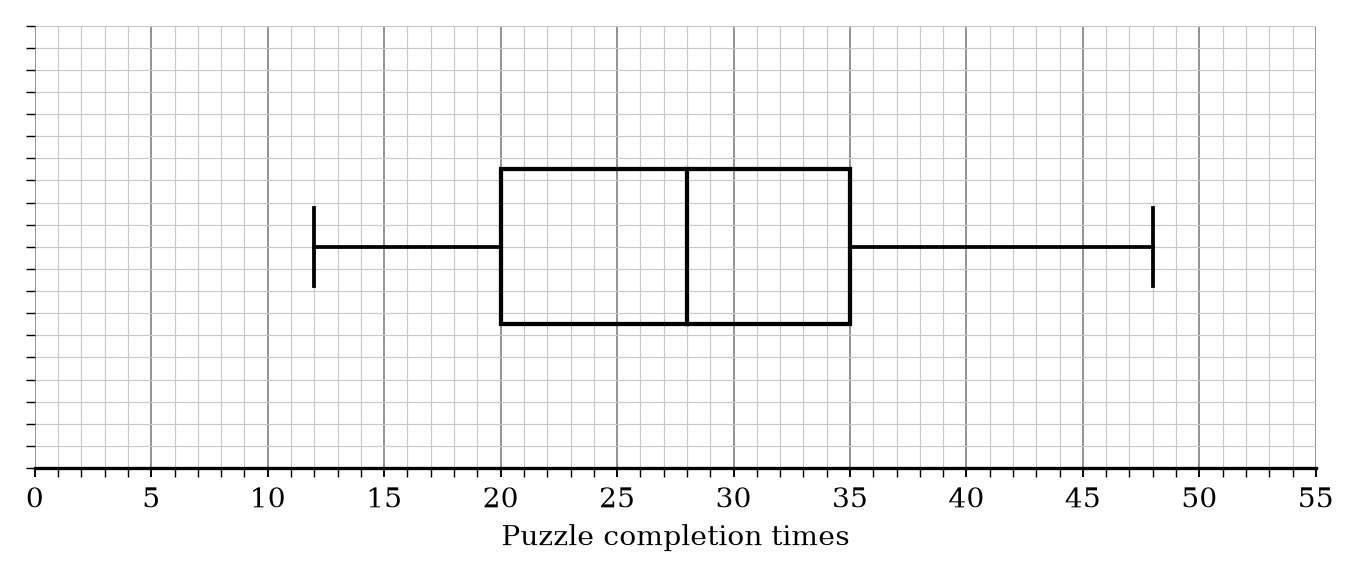
Compare the distribution of the times for Class A with the distribution of the times for Class B.
27 exam-style questions on Edexcel GCSE Maths Box Plots. Each one has a worked solution and a mark scheme showing where the marks go.

