Question 5
The scatter graph shows information about the test scores of some students in Maths and the number of hours they spend watching TV a day.
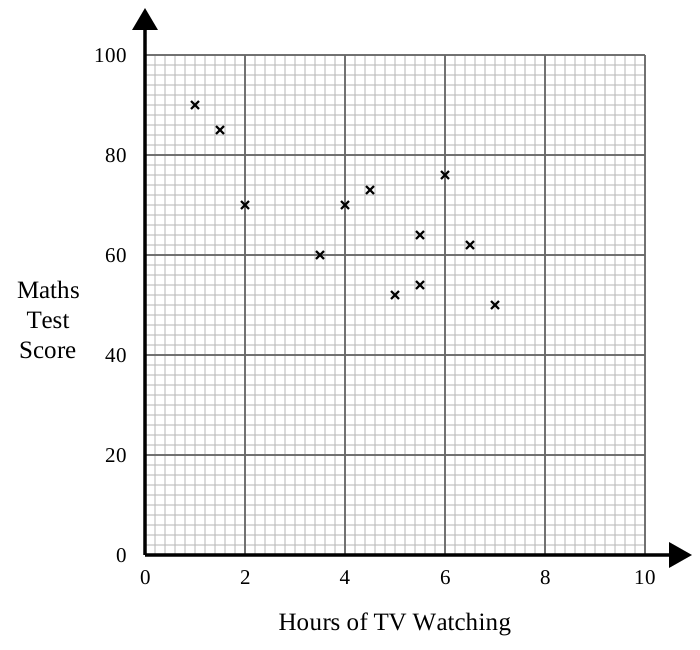
| Hours of TV Watching | Maths Test Score |
|---|---|
| 1 | 90 |
| 1.5 | 85 |
| 2 | 70 |
| 3.5 | 60 |
| 4 | 70 |
| 4.5 | 73 |
| 5 | 52 |
| 5.5 | 64 |
| 5.5 | 54 |
| 6 | 76 |
| 6.5 | 62 |
| 7 | 50 |
a.[1]
What type of correlation does the scatter graph show?
b.[1]
Billy says, "If I reduce the amount of TV I watch my Maths test score will improve." Comment on what Billy says.
Scatter Graphs Questions
55 exam-style questions on Edexcel GCSE Maths Scatter Graphs. Each one has a worked solution and a mark scheme showing where the marks go.