Question 27
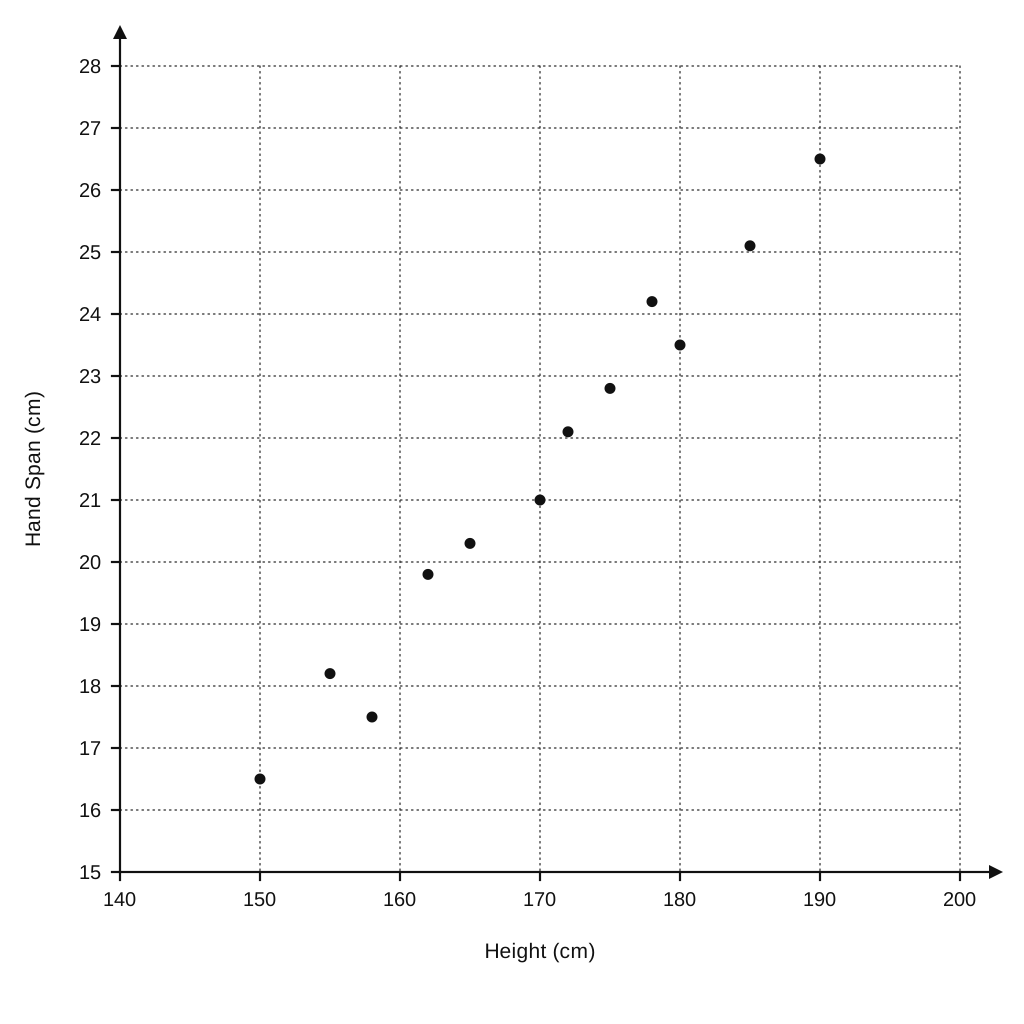
The scatter graph shows the heights (cm) and hand spans (cm) of 12 adults.
| Height (cm) | Hand Span (cm) |
|---|---|
| 150 | 16.5 |
| 155 | 18.2 |
| 158 | 17.5 |
| 162 | 19.8 |
| 165 | 20.3 |
| 170 | 21.0 |
| 172 | 22.1 |
| 175 | 22.8 |
| 178 | 24.2 |
| 180 | 23.5 |
| 185 | 25.1 |
| 190 | 26.5 |
a.[1]
What type of correlation does the scatter graph show?
b.[2]
Another adult has a height of 168 cm. Estimate the hand span for this adult.
Scatter Graphs Questions
55 exam-style questions on Edexcel GCSE Maths Scatter Graphs. Each one has a worked solution and a mark scheme showing where the marks go.