Question 45
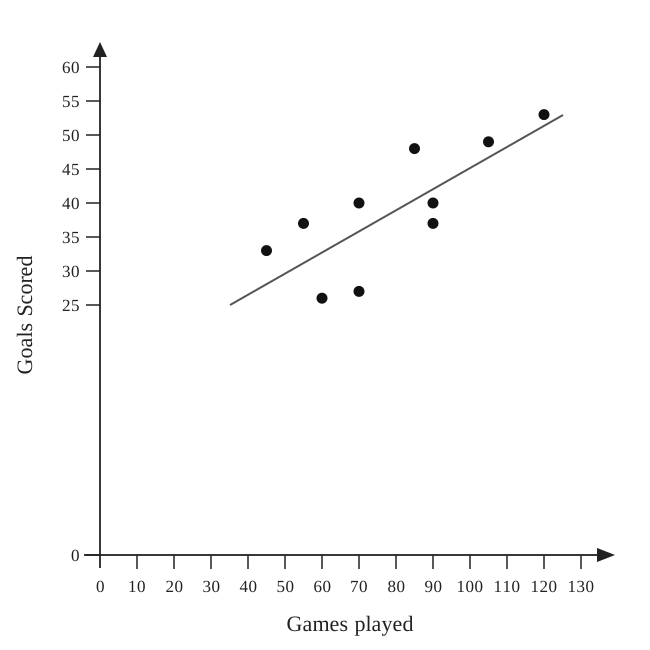
Wayne has data about the number of goals 10 football players had scored and the number of games they had played. He was asked to display the data on a scatter graph. Here is his answer.
| Games played | Goals Scored |
|---|---|
| 45 | 33 |
| 55 | 37 |
| 60 | 26 |
| 70 | 40 |
| 70 | 27 |
| 85 | 48 |
| 90 | 40 |
| 90 | 37 |
| 105 | 49 |
| 120 | 53 |
Wayne has plotted the points accurately.
Write down one thing that is wrong with his answer.
Scatter Graphs Questions
55 exam-style questions on CCEA GCSE Maths Scatter Graphs. Each one has a worked solution and a mark scheme showing where the marks go.