Question 20
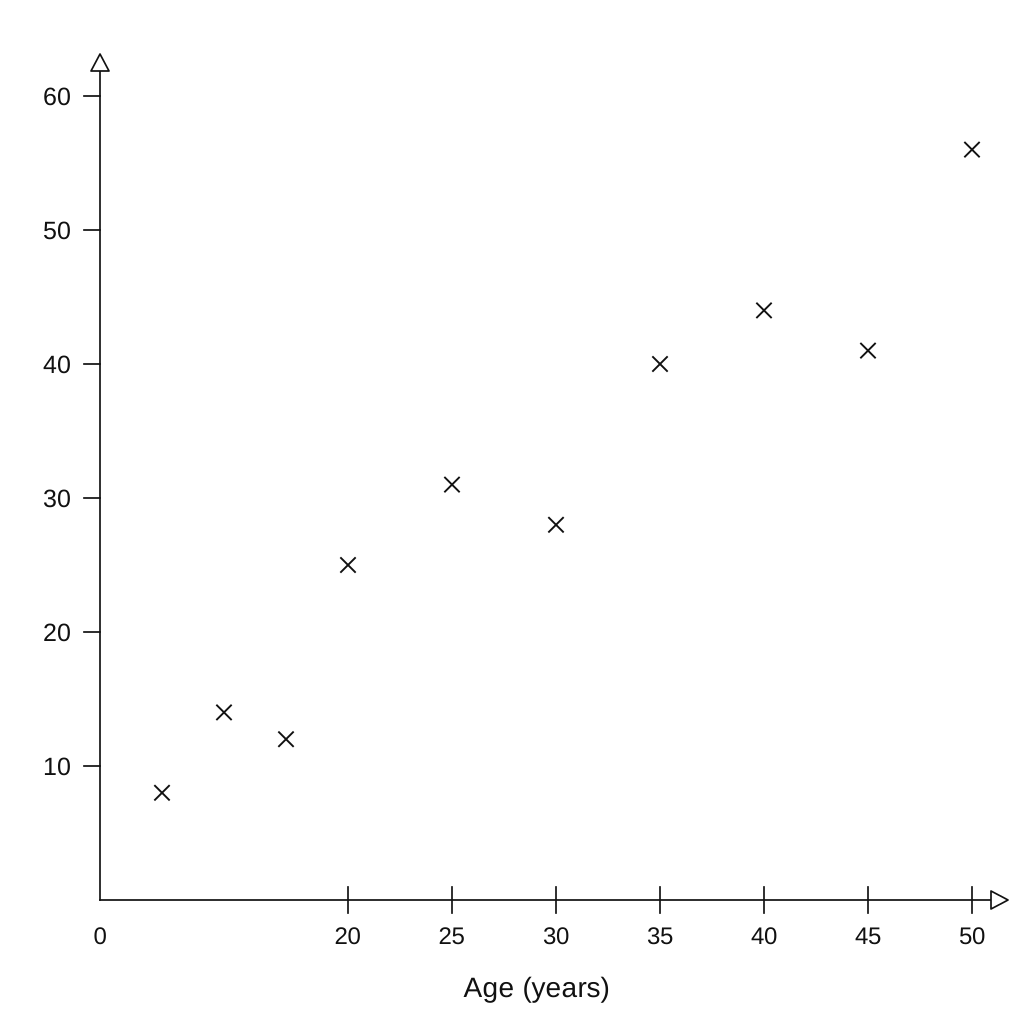
Liam recorded the age of 10 trees and the diameter of their trunks in cm. He was asked to display the data on a scatter graph. Here is his answer.
| Age (years) | Diameter (cm) |
|---|---|
| 5 | 8 |
| 10 | 14 |
| 15 | 12 |
| 20 | 25 |
| 25 | 31 |
| 30 | 28 |
| 35 | 40 |
| 40 | 44 |
| 45 | 41 |
| 50 | 56 |
Liam has plotted the points accurately.
Write down two things that are wrong with his answer.
Scatter Graphs Questions
55 exam-style questions on CCEA GCSE Maths Scatter Graphs. Each one has a worked solution and a mark scheme showing where the marks go.