Question 2
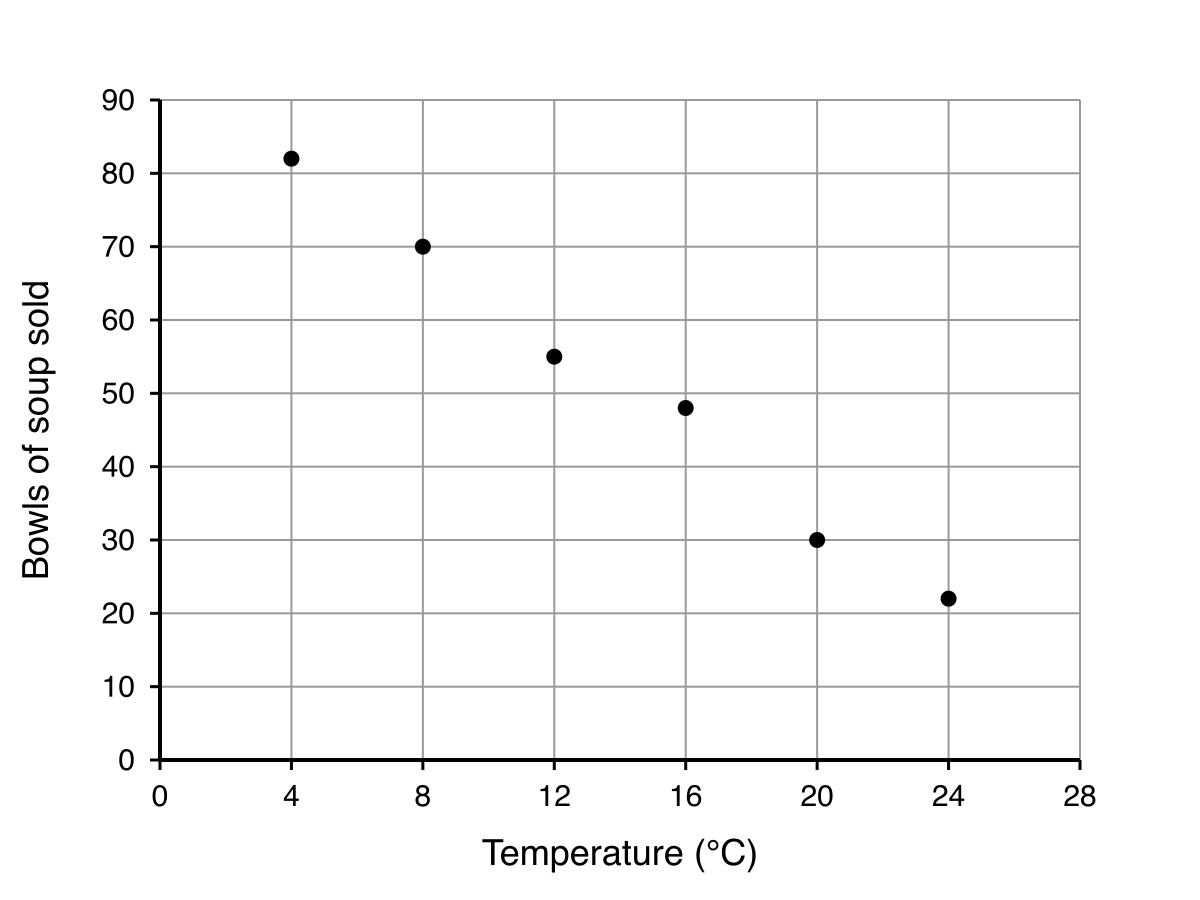
The scatter graph shows information about the outside temperature and the number of bowls of hot soup sold in a cafe.
| Temperature (∘C^{\circ}\text{C}∘C) | Bowls of Soup Sold |
|---|---|
| 4 | 82 |
| 8 | 70 |
| 12 | 55 |
| 16 | 48 |
| 20 | 30 |
| 24 | 22 |
a.[1]
What type of correlation does the scatter graph show?
b.[1]
The shopkeeper says, "If I sell more soup today, the temperature outside will drop." Comment on what the shopkeeper says.
Scatter Graphs Questions
55 exam-style questions on CCEA GCSE Maths Scatter Graphs. Each one has a worked solution and a mark scheme showing where the marks go.