Question 21
The scatter graph shows information about the engine size and CO2\text{CO}_2CO2 emissions for several cars.
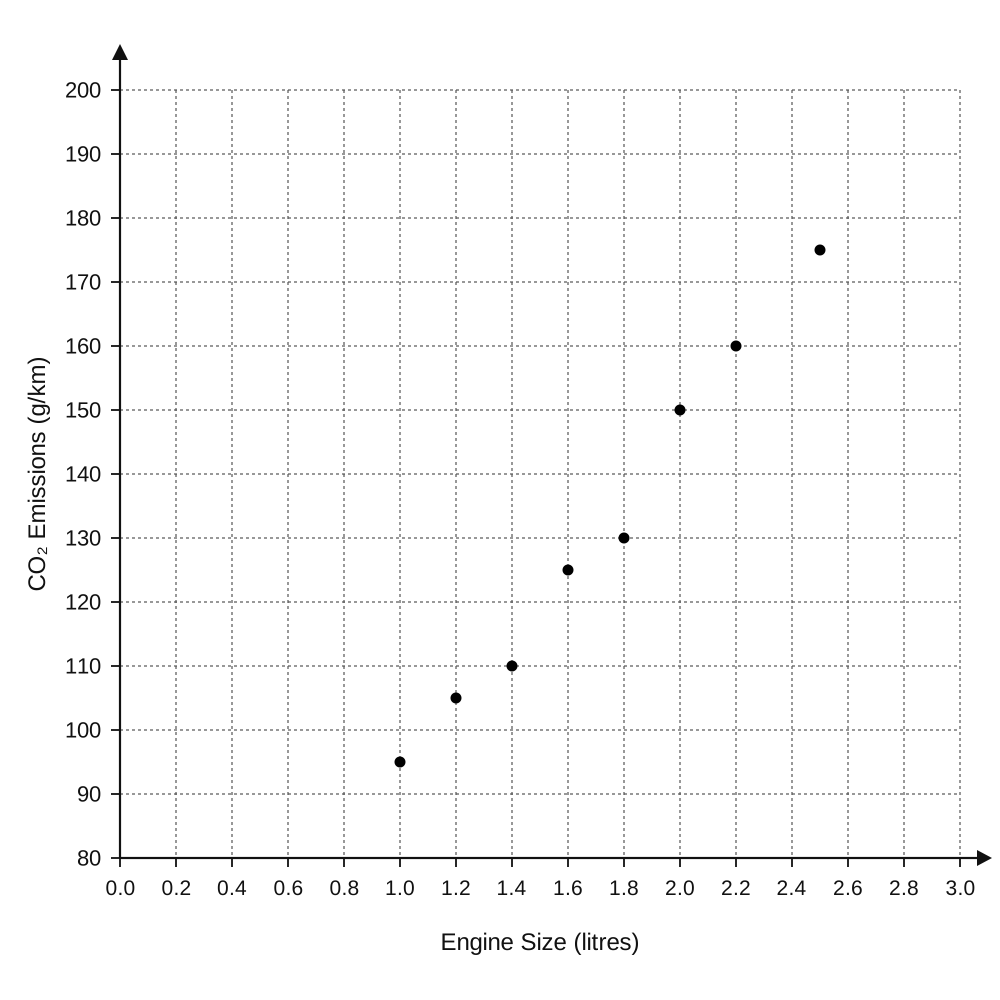
| Engine Size (litres) | CO2\text{CO}_2CO2 Emissions (g/km) |
|---|---|
| 1.0 | 95 |
| 1.2 | 105 |
| 1.4 | 110 |
| 1.6 | 125 |
| 1.8 | 130 |
| 2.0 | 150 |
| 2.2 | 160 |
| 2.5 | 175 |
The table shows the engine size and emissions for two more cars.
| Engine Size (litres) | 1.5 | 2.4 |
| CO2\text{CO}_2CO2 Emissions (g/km) | 120 | 165 |
a.[1]
Show this information on the scatter graph.
b.[2]
Another car has CO2\text{CO}_2CO2 emissions of 140 g/km. Use the scatter graph to estimate the engine size for this car.
Scatter Graphs Questions
55 exam-style questions on CCEA GCSE Maths Scatter Graphs. Each one has a worked solution and a mark scheme showing where the marks go.