Skip to content
MathsGenie logo
Open app

Course home

  1. GCSE
  2. Geography OCR A
  3. Question bank

UK population change

EasyMediumHard
123456789101112131415161718192021222324252627
Question 26

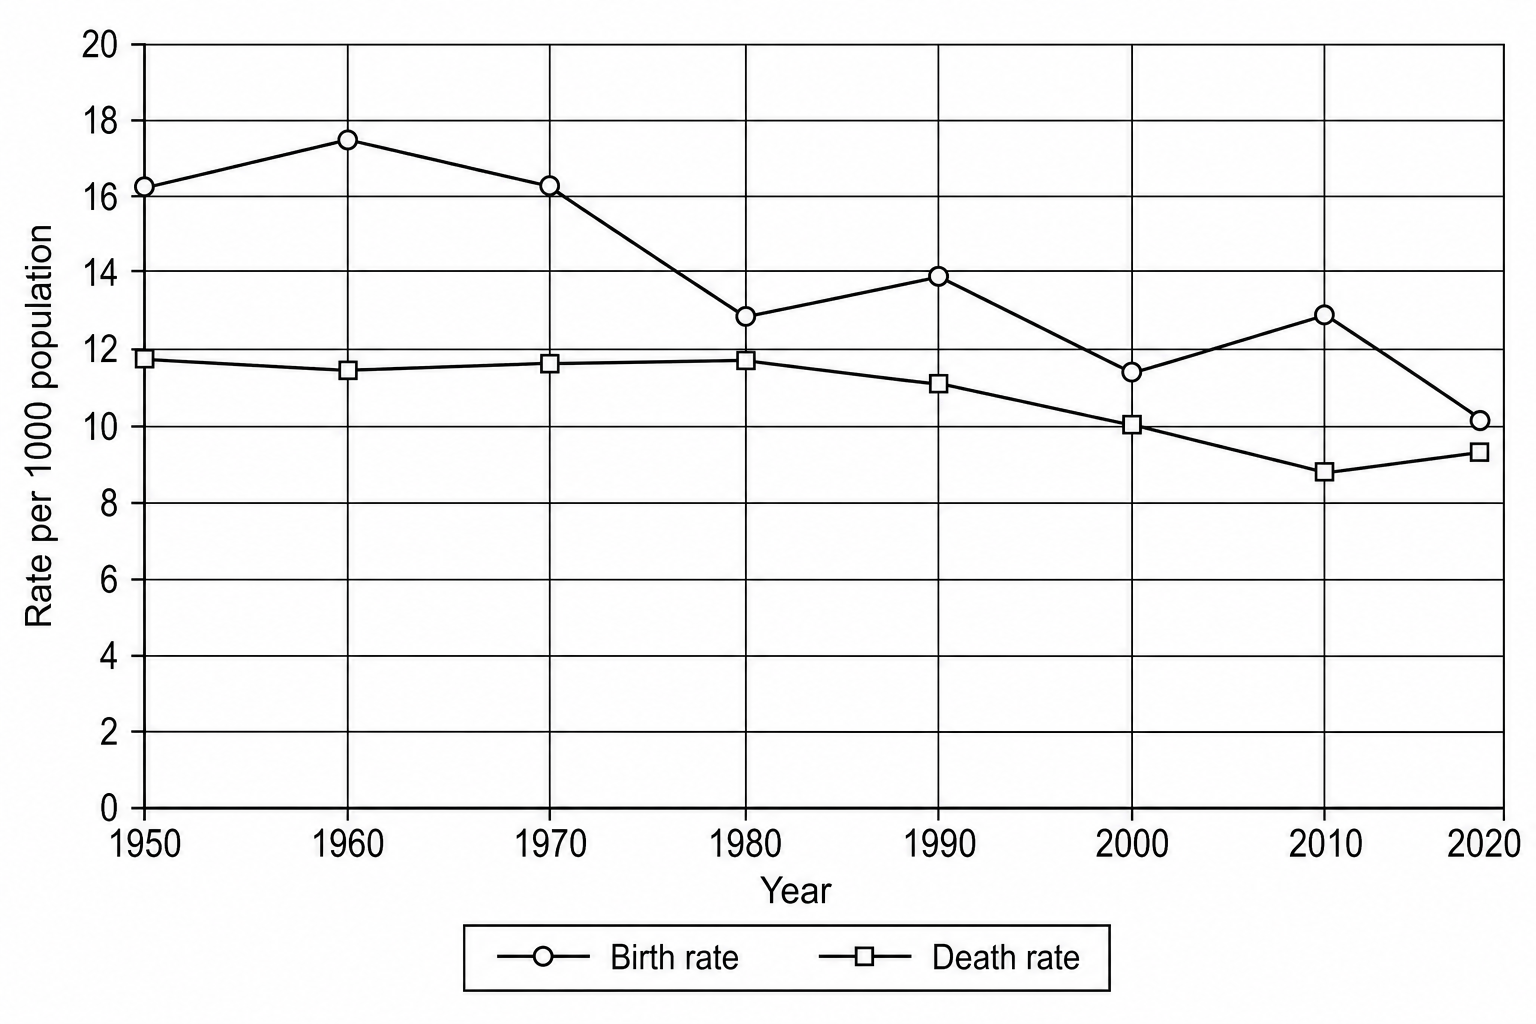
Study the figure below, a line graph showing birth and death rates in the UK between 1950 and 2020.

Figure: UK Birth and Death Rates (1950-2020)

In which year was the UK birth rate exactly 17.5 births per 1000 population?
[1]

UK population change Questions

  1. GCSE
  2. /Geography
  3. /UK population change

